Drinking water is one of the most vital resources on earth, and the idea of commercializing such commodity in the shape of bottled water was recorded to begun in the early 1600s in the United Kingdom. However it was not until the 1970s that bottled water was taking shape into what we know now—packaged in plastic bottles. Within the same decade, Indonesia saw its first bottled water company—PT. Golden Mississipi (now PT. Tirta Investama), or more popularly known for its still bottled water brand, Aqua.
Fast forward to now, a recent headline by Bisnis Indonesia reads “Indonesia’s Bottled Water Industry could be the Biggest in ASEAN.” Such statement has been proven to be true as the production of bottled water in Indonesia is continually increasing and that many new investors are looking into such business. According to a report by Indonesian Association of Packaged Drinking Water (Aspadin), Indonesia’s national production of bottled water have reached 24.7 billion liters in 2015 and it is expected to rise up to 27.7 billion liters this year.
However, there is little known facts on the actual consumption of bottled water in Indonesia. So with that in mind, Snapcart analyzed its real-time receipt data to look for certain uniqueness within the performance of bottled water, represented by sales of still bottled water category throughout January to November this year.
Water for the Weekend
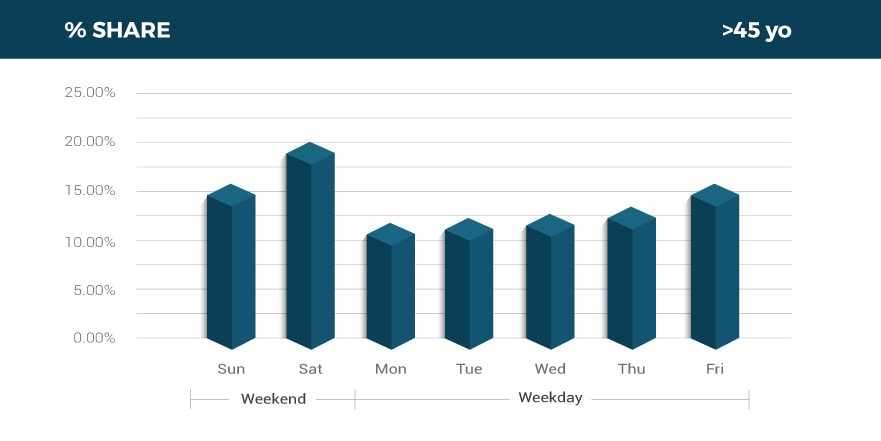
To see the actual consumption of bottled water, we decided to look into the share of daily average of sales for still bottled water category throughout the year. As shown by the graph below, the weekend period (Saturday and Sunday), dominates the still bottled water purchases, whilst within the weekday period, Monday is shown to be the day with the lowest share at 12%. On the other hand, Sunday has the highest share reaching as much as 18%. The purchase peaks during the weekend can be assumed as many of Indonesian would be out of their homes for their weekend getaway.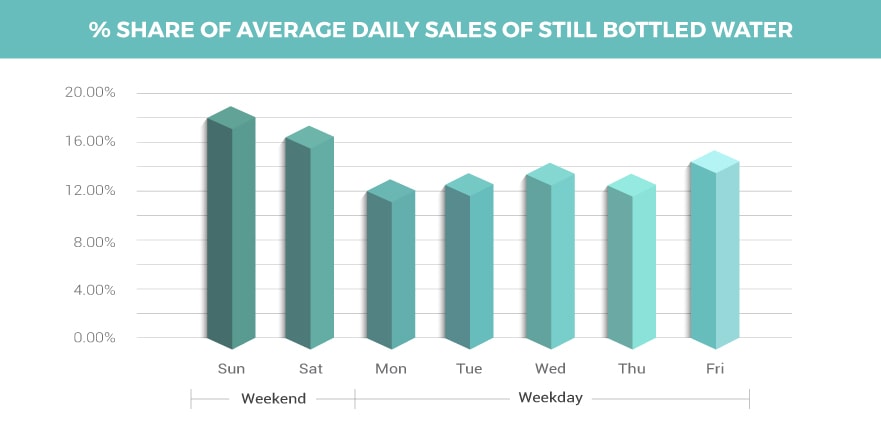
Since the still bottled water purchases is proven to be made mostly on weekends, then the newfound fact begs the question—who bought the category on weekends the most compared to weekdays? To find the answer, we look into Indonesia’s demography by age groups.
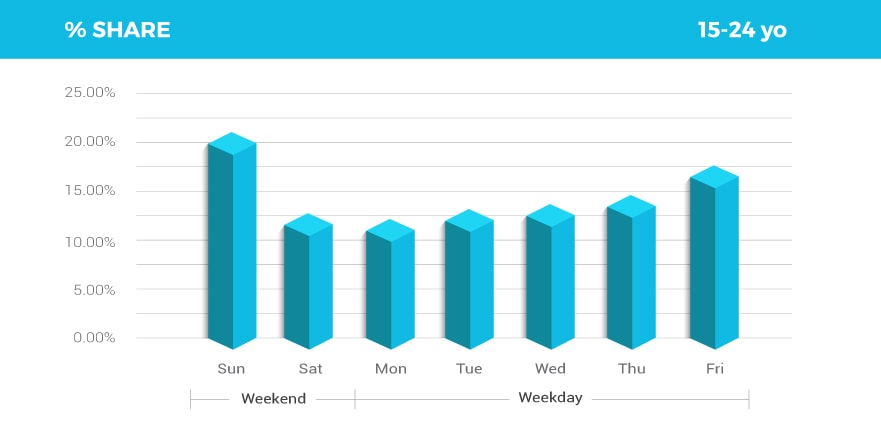
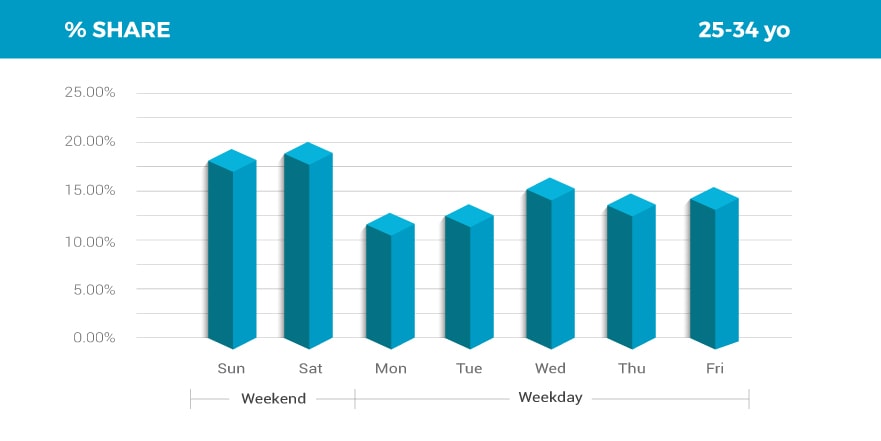
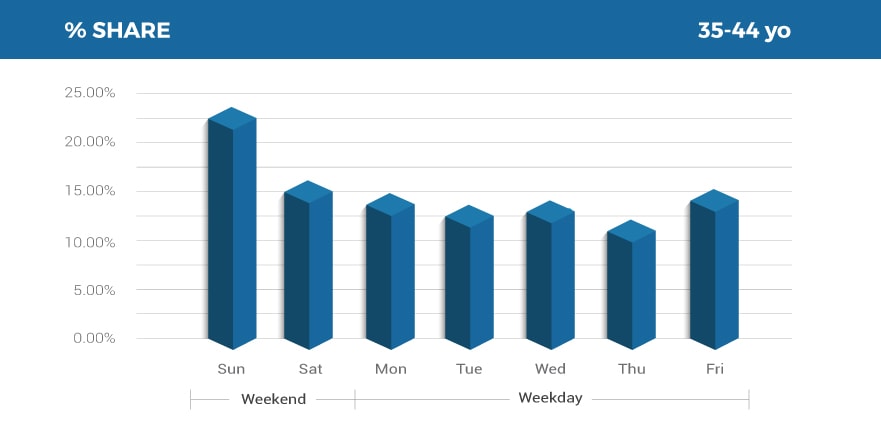
The graphs above show each of the four purchase decision maker (PDM) age groups’ daily sales on the category. It can be seen that the 25-34 and 35-44 year-old age groups tend to mostly buy on weekends compared with other age groups, while the 45+ year-olds following those groups. However as an overall consumption as shown below, it is actually quite surprising the fact that it is the 45+ year-old age group who consume most of the category, while the 25-34 year-old age group takes the second place
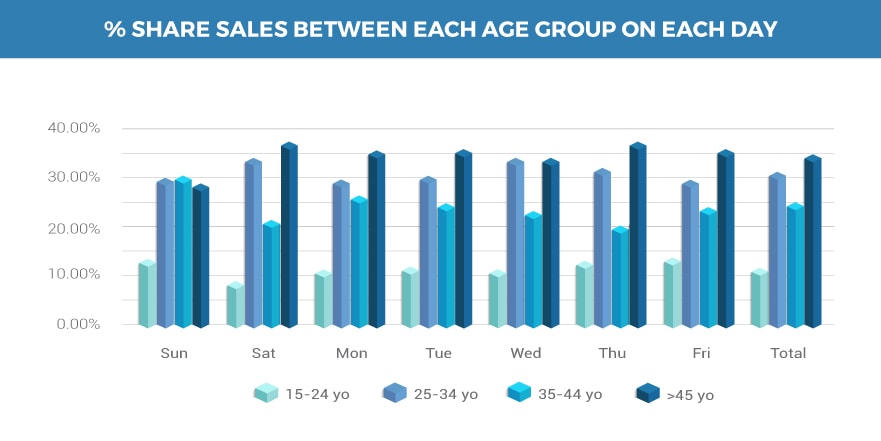
This is an interesting fact for the reason that when looking at Indonesia’s demographic composition, the country has a young population, which implies that a large chunk of the nation’s population is of the productive age. Therefore most of the purchases should, in theory, belong to the 25-34 year-old group, especially that according to the latest 2016 estimate, Indonesia’s population median age is 28.6 years.
Where and when in the Weekend?
So now that we’ve established the fact that still bottled water are mostly purchased in the weekend by Indonesians within the age groups of 25-34 and 35-44 year-old, the next questions we have are: where do they buy the category, and which part of the day do they buy them? Shown on the graphs below minimarket retail format dominates the purchases of still bottled water category, bear in mind that the figures for weekdays below composed of the rest of five days in the week.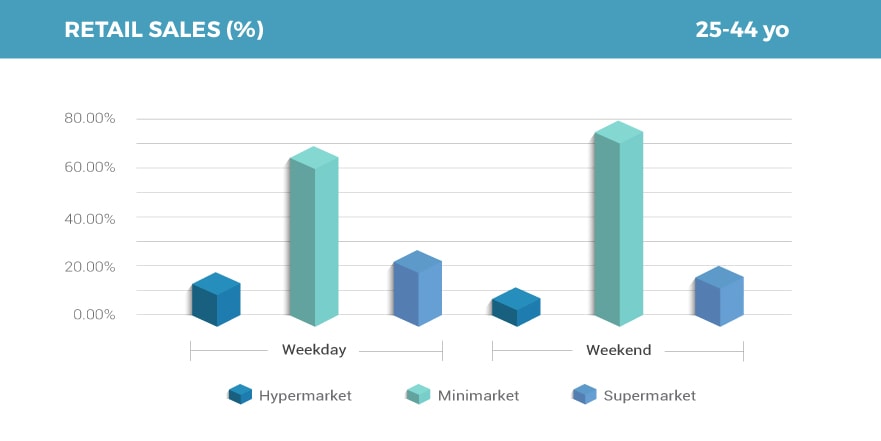

Additionally, we also took a peek into the figures for other age groups and the results are still the same. This further proves that the category belongs to the top-up or immediate-use kind of purchases, given the fact that most of those kinds of purchases happening mostly at mini markets.
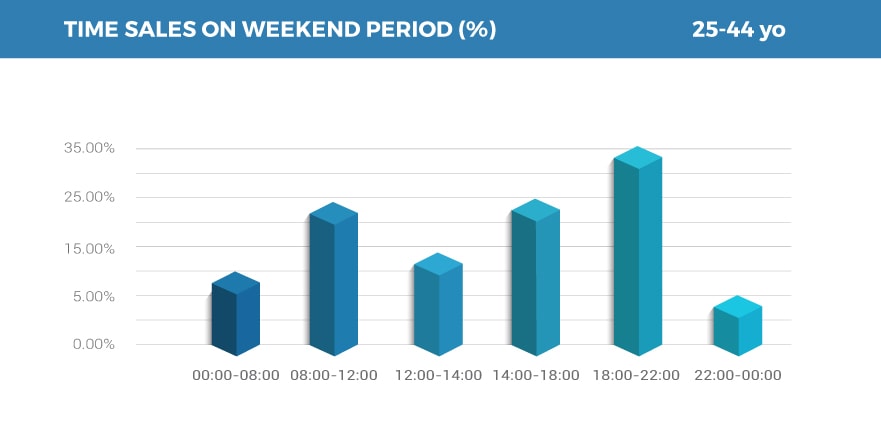
Looking deeper into the purchase habits of still bottled water category for the same age group, we found that within an average weekend most of the purchases of the 25-44 year-olds happened between the 18:00 to 22:00. Furthermore, the second and third timeframes for this specific age group to make their purchases are between 08:00-12:00 and 14:00-18:00, respectively. Moreover, just like the retail format data, we also find similar pattern for time of purchase within other age groups.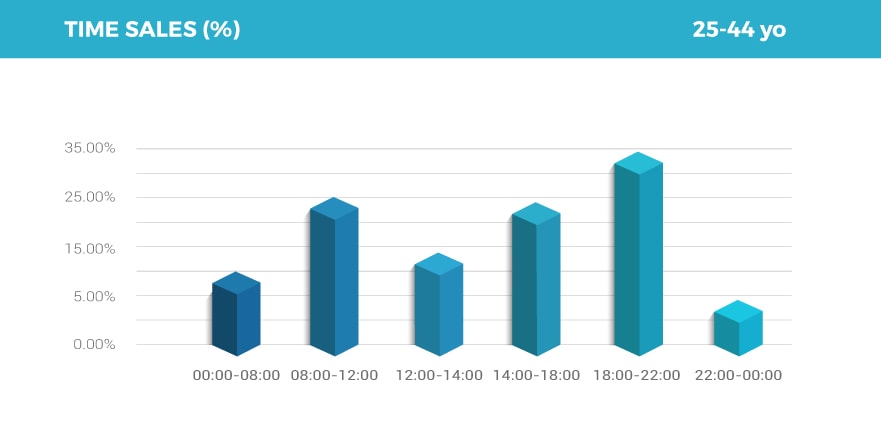
Water’s Affinity
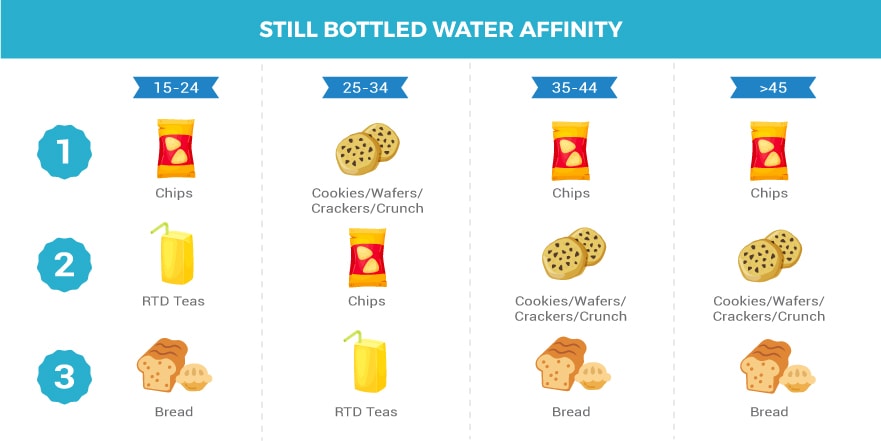
Most of the recorded purchases for still bottled water category are those with at least 3 other categories in the basket. The graph below shows that throughout the age groups, chips is the category with the most affinity with still bottled water. Cookies/Wafers/Crackers/Crunch and Bread categories come to a close second after Chips, while ready-to-drink tea category is proven to be a popular choice amongst the 15-34 year-old still bottled water PDMs.
In Conclusion…
Overall, still bottled water category in Indonesia is purchased mostly by 45+ year-olds with % share of 34% and most of their purchases on done on Saturday compared to other days. However, looking at behavior between different age group, the 25-44 years old group are the ones who purchase most on weekends compared to other age group.
For the overall sales of the category, it can be assumed that despite it being bought mostly by the older age groups, please bear in mind that they are the purchase decision makers, meaning that they may be the ones who bought it but not necessarily the ones who consumed it at the end. Whilst on the other hand, the same cannot be said for still bottled water purchased by the 25-34 year-olds for the reason that most people within the age group may either still be single or couples with no children. Therefore they can be safely assumed to be both the PDMs as well as the end-user.