Minimarkets in Indonesia have been hailed as the “killer” of supermarkets since 2012. Its rapid growth has been largely driven by the increasing numbers of Indonesia’s middle class, where the demands for products and convenience have steadily grow hand-in-hand. Despite the slight slowing down of the country’s economy in 2015, minimarkets’ growth didn’t show any signs of the same nature. According to the latest report by Fitch Ratings, there were about 1,200 additional new stores—from Indonesia’s two largest minimarket operators; Alfamart and Indomaret—opened their doors in 2015 for business throughout the archipelago, and the rating agency also expects an additional 1,000 stores to be open this year.
Such significant growth and performance for the retail format are not at all surprising given that the high demands are matched with the low operational capital commitment that the minimarket format has. This means that minimarkets can penetrate areas that are of lower traffic with easiness that can’t be otherwise found in its hyper and supermarket counterparts. Moreover, the substantial rise in the number of minimarkets might also hints a change in customers’ shopping behavior within the field of modern retail formats. So, looking at the current trends of minimarkets, is it possible that Indonesians are now shifting their grocery shopping habits from the bulk-purchase at hyper and supermarkets to a smaller but more frequent buys at minimarkets?
To answer this, we pulled information from our single-source panel and receipts data to see if a shift in Indonesians’ shopping behavior is really happening. To provide a more current and up-to-date information, all data are based on real-time receipt figures taken from January 2016 to August 2016.
Mini is Big!
To look at the purchase patterns across the retail formats we decided to look at the customers’ share of wallet where it shows which portion of their spending goes to which format. The graph below is the total Indonesian share of wallet starting from January 2016 to August 2016. It shows that not only minimarkets dominate the shoppers’ spending, its size is also growing from just below 50% to hitting the 60% mark in August. So, as minimarket’s percentage rises, supermarkets and hypermarkets have steadily losing its share when it comes to their share in Indonesian shoppers’ wallets. Hypermarkets and supermarkets lost in total over 10% of their market share in just a course of 8 months.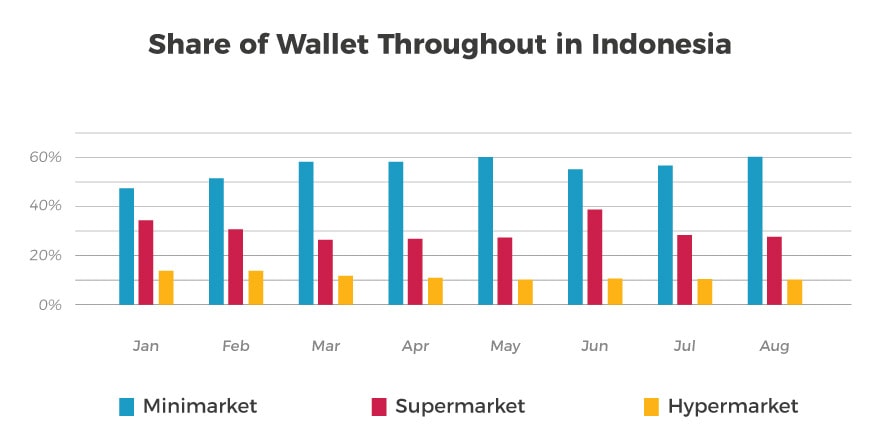
From the data above it can be concluded that there is a shift in purchase behaviors in Indonesia. Moreover, we are digging deeper into our data to see the scale of this shift. Does such shift in shopping habits of Indonesians have spread throughout the country? Or is it only focused in just one part of the archipelago?
Looking at the number of minimarket chains in and outside Java as recorded on our data, Java has more number of chains. This number also corresponds with the fact that Java is also home to about 140 million Indonesians, which is significantly more than half of the entire population of the country.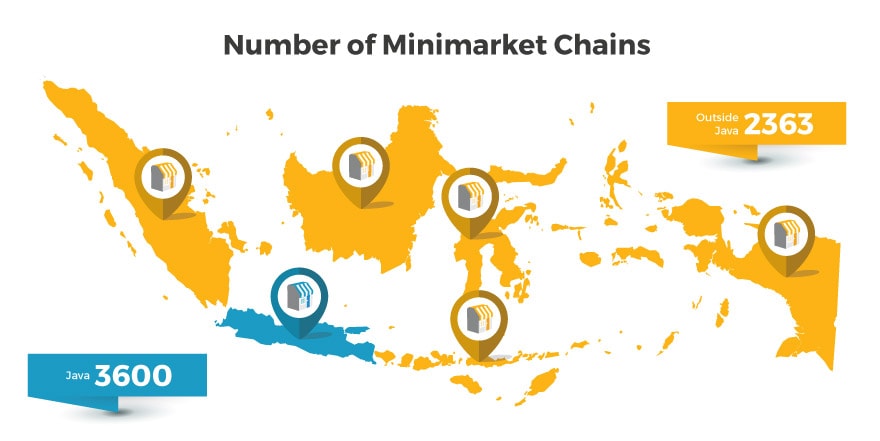
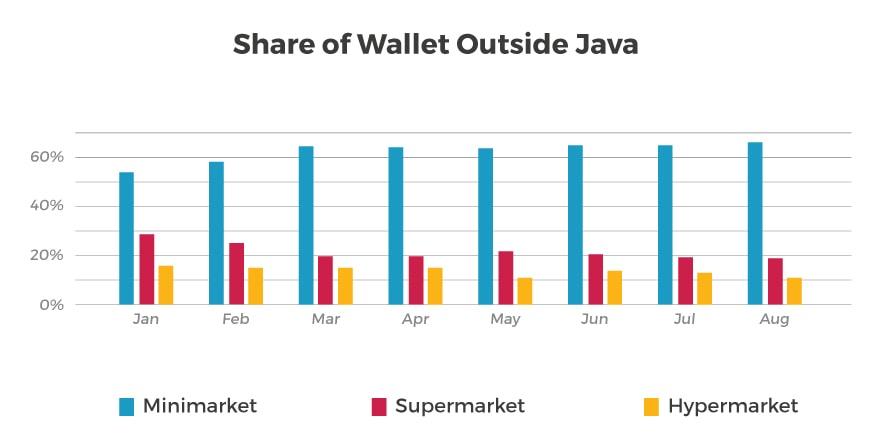
With this fact at hand, then we go and look on the same data sets as previous one while adding Java and outside Java as new variables. Shown on the graphs below, share of wallet of minimarket in Java has risen from 45% in January to just below 60% in May, then it slightly fell to 55% in June but continued rising again to 59% in August. However, from what we found, it is quite surprising that the share of wallet of minimarket outside Java is actually higher than the ones in Java despite having less number of minimarkets.
Looking at the share of wallet outside Java, it shows that people outside Java are spending more at minimarkets than those of Java residents as its share of wallet never falls under the 50% mark. In fact, minimarkets’ share of wallet outside Java has significantly risen to around 66% in August.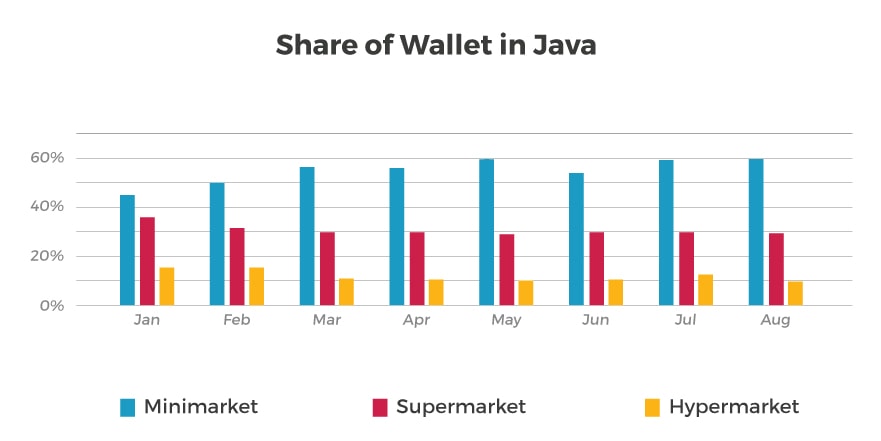
What drives the shift?
From the data sets above, it can be safely concluded that there is, in fact, a shift in consumer spending from the supermarkets and hypermarkets to minimarkets. Then, this newfound fact begs the question of why. Is the shift of purchases to minimarkets driven by convenience? Or do other factors play another role in the rise of minimarkets’ share? So to find out about this other factor, we are looking into the discount rates and the price perception of minimarkets.
Amongst all the modern market formats, minimarkets have the deepest discount rate. Taken from the receipt data we have, the graph below shows that the discount rates in minimarkets never falls under the 20% mark throughout January to August 2016. While at the same time, hypermarkets have the lowest rates with discounts reaching the 20% mark for their products only around February, March, and June, and supermarkets reaching above 20% average discount rate only around the first three months of 2016.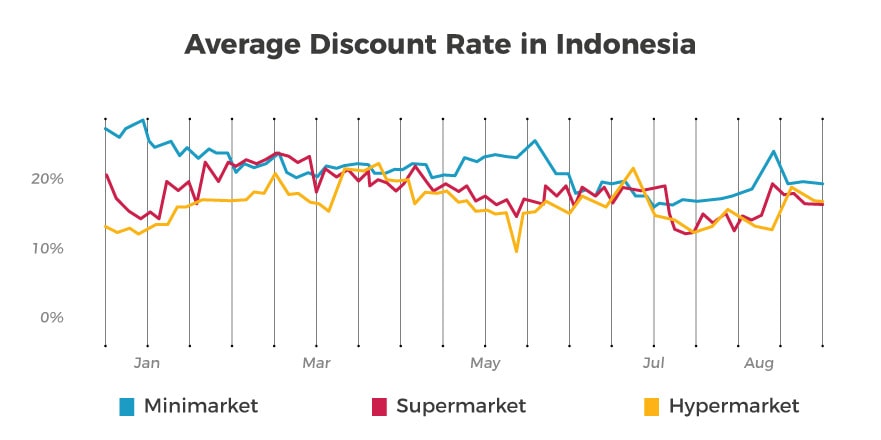
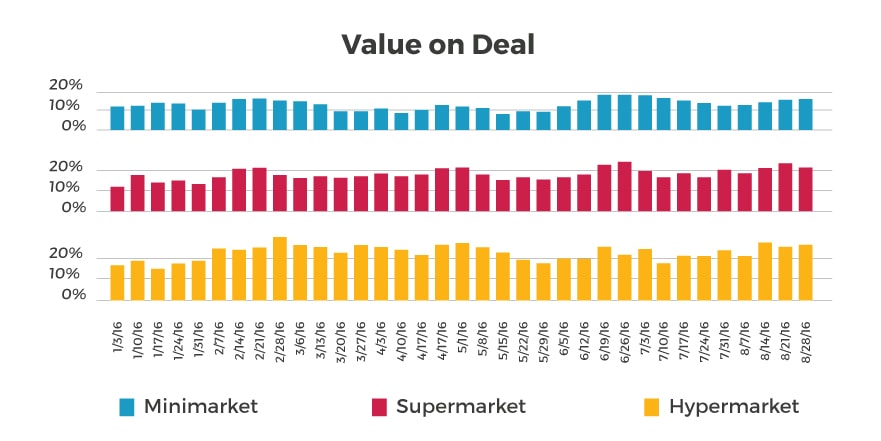
When looking at the percentage of promoted products to total basket size, Value on Deal,(graph below), it shows that a good amount of items within the hypermarket and supermarkets shoppers’ baskets–reaching close to 20% and some even go above 20%–are filled with discounted products. Whilst about less than 20% of the minimarket shoppers’ baskets are filled with promoted items. This could mean that there is a possibility that shoppers’ purchases in minimarkets are driven by cheaper price perception due to the depth of discount rate. However once they have made the purchase, they actually buy products that aren’t discounted due to either product affinity or purchase impulsivity and unplanned shopping.
With all these facts in mind, could price perception really drive the rise of minimarket shopping? To find out, we conducted a survey comparing 14 different level 2 product categories for each retail format on the price perception of each category. The 14 product categories we are looking include; baby care, baby food, beverage, breads and pastries, cereals and grains, confectionary, cooking needs/condiments, dairy, health, household care, personal care, preserved food, snack, and spread. We asked over 3,000 respondents on how expensive the average price of each category in minimarkets compared to super and hypermarkets. The results shows that respondents agreed that the prices in minimarkets for most categories are the same as super and hypermarkets, with the exception for the prices of baby care and baby food categories where respondents think that they are more expensive at minimarkets than its modern retail counterparts.
In conclusion…
The main driver for the shift of Indonesian shoppers from hyper and supermarkets to minimarkets may be simply because of the convenience minimarket offers. Minimarket’s low capital requirements allow it to penetrate and exist in areas in the country that are remote and of low traffic, making it the only retail choice for customers in such environment.
While price perception might not play an important role in the shift, minimarkets’ deep discount rate may contribute as an important bait for shoppers to make purchases at their stores. Furthermore, when looking at the percentage of promoted products to total basket size, only 10% are discounted while the other 90% of the content within the minimarket’s baskets are filled with products that are not discounted. This proves that minimarket is a healthier option for your brands’ product categories to either start using it as a channel or continue with its usage.