In an era where e-commerce overwhelmingly dominates everyday shopping, a crucial question arises for marketers and brand strategists: does consumer enthusiasm for visiting physical, offline events still hold strong? To answer this, Snapcart conducted an online survey in August 2026 aiming to unpack public enthusiasm, attendance habits, spending behavior, and overall visitor comfort when navigating public offline gatherings.
For the scope of this study, “Offline Events” specifically refer to public gatherings such as Exhibitions, Expos, Fairs, Festivals, and Bazaars or Pop-up Markets (including major flagship events like GIIAS, Jakarta X Beauty, Brightspot Market, Culinary Festivals, IMBEX, Mall Bazaars, Comic-Con, and similar concepts). This definition strictly excludes closed or professional gatherings such as Seminars, FGDs, Workshops, Job Fairs, or Internal Corporate Events. By capturing attendee perspectives across diverse events, this survey provides actionable insights for brands, organizers, and marketers to better understand event dynamics and optimize on-site conversions.
Respondent Profile
This study is based on a nationwide sample of 1,507 respondents who actively attended at least one offline event in the past 12 months. The demographic breakdown reflects a highly active consumer base across diverse age groups and genders.
The survey demographic leans majority female at 63%, while male attendees represent 37%. In terms of age distribution, the respondent pool is heavily concentrated among young adults and prime working-age consumers. Participants aged 25-34 make up the largest segment at 33%, closely followed by those aged 18-24 at 32%. Attendees aged 35-44 represent 26% of the sample, while mature consumers aged 45 and above account for 6%, and student attendees under 18 make up 3%.
Part 1: Overall Visitor Behavior and Trends
Event Attendance Frequency and Relevance
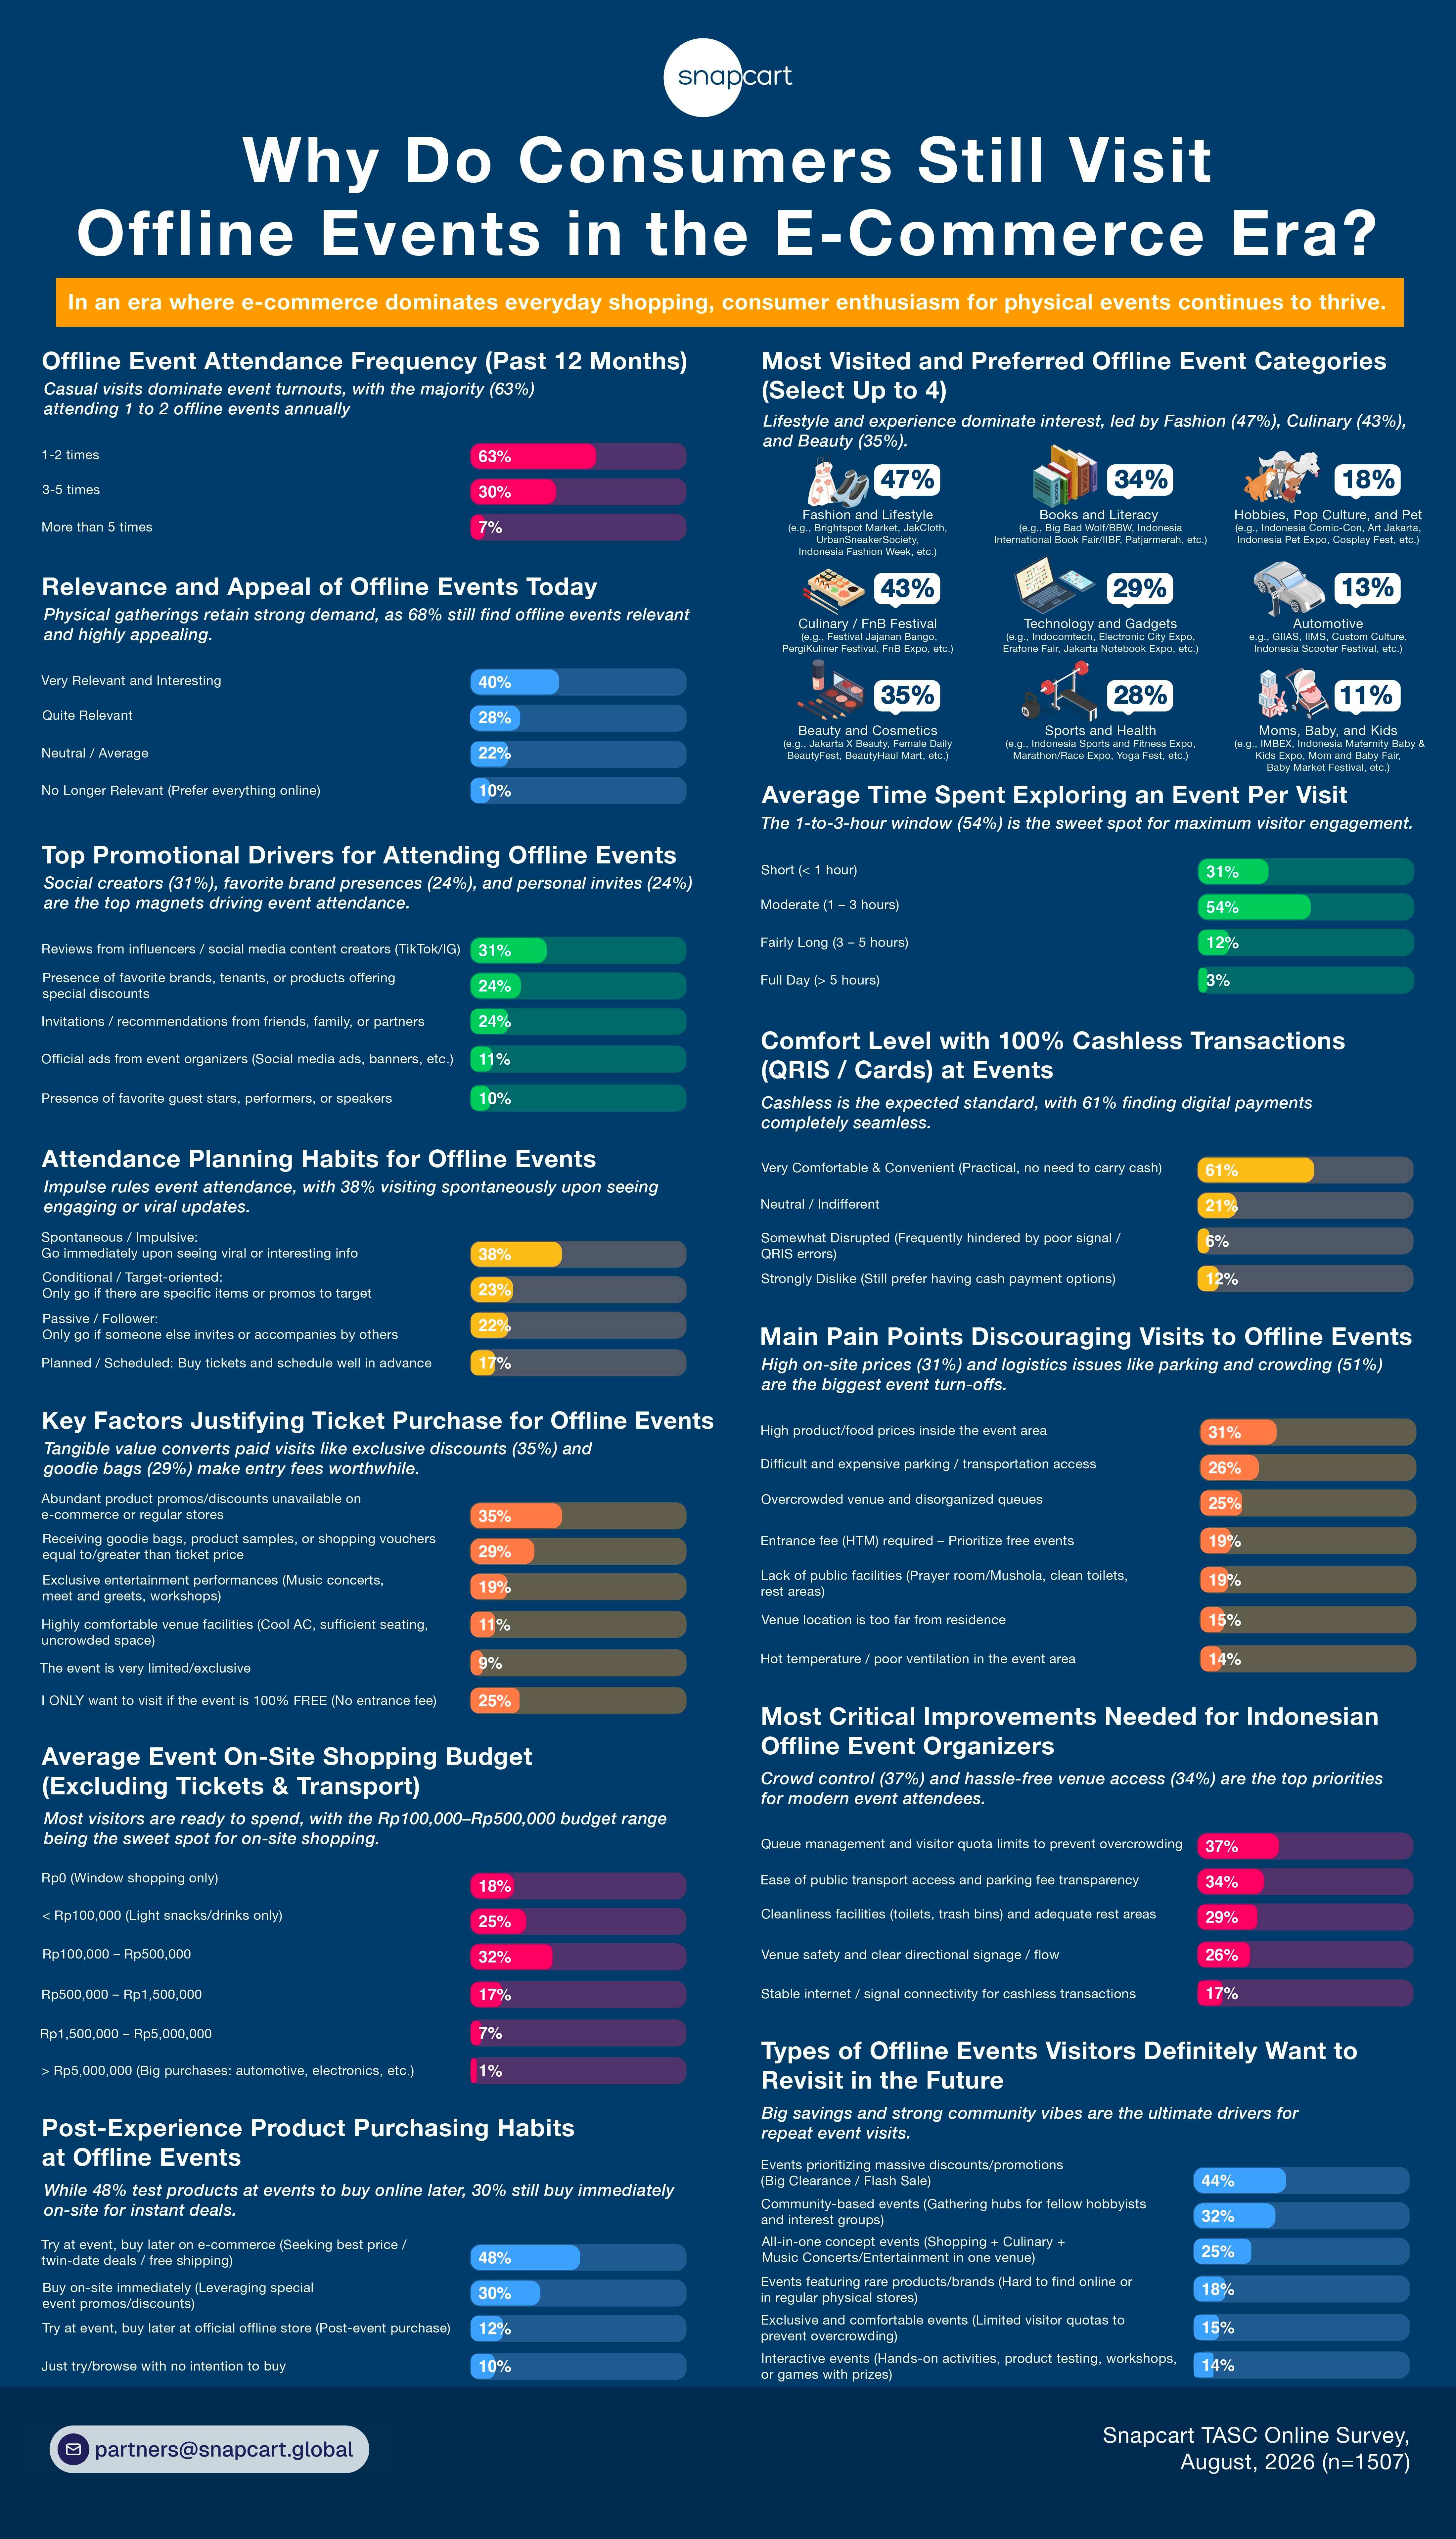
Given that our survey screened for active event-goers who attended at least one physical gathering in the past 12 months, the data shows that 63% of respondents attend events 1 to 2 times per year, representing the majority group of moderate attendees. Meanwhile, 30% attend 3 to 5 times per year, and 7% qualify as high-frequency visitors who participate more than 5 times annually.
Despite the prevalence of online shopping, 40% of respondents find offline events “Very Relevant and Interesting”, while 28% view them as “Quite Relevant” and 22% feel neutral (“Ordinary”). Only 10% consider physical events no longer relevant due to a preference for online shopping. This high baseline of relevance (68% combined) demonstrates that physical gatherings fulfill a distinct experiential function that digital channels cannot replicate, maintaining steady demand among both selective and frequent attendees.
Promotional Drivers and Planning Habits
Information discovery and attendance triggers are heavily led by social media influencers and word-of-mouth: reviews from influencers or content creators on TikTok/IG lead at 31%, followed equally by the presence of favorite brands/tenants offering special discounts (24%) and recommendations from friends, family, or partners (24%). Official advertising from organizers (social media ads, banners) accounts for 11%, while favorite guest stars, performers, or speakers drive 10%.
Planning habits reflect a strong tilt toward spontaneity: 38% of respondents attend on impulse right after seeing viral or interesting information online. Meanwhile, 23% are conditional/target-oriented (only going if there are specific items or promos targeted), 22% are passive/followers (only going when invited or accompanied by others), and 17% plan their visits well in advance. The strong correlation between influencer-driven discovery (31%) and impulse planning (38%) indicates that real-time social proof acts as the single strongest catalyst for converting passive online viewers into immediate physical attendees.
Ticket Justifications and On-Site Spending
Entry fee acceptance is tied directly to tangible financial and experiential value. When asked which factors make them willing to pay a ticket fee (multiple choice), 35% cite exclusive promos/discounts unavailable in standard retail/e-commerce, 29% point to receiving goodie bags, product samples, or vouchers equal to or exceeding the ticket price, and 19% highlight exclusive entertainment (concerts, meet and greets, workshops). Comfortable venue facilities justify fees for 11%, while event exclusivity accounts for 9%. Notably, 25% state they only visit if the event is 100% free.
Once inside, 82% allocate an active on-site shopping budget. The core budget bracket sits between Rp100,000 and Rp500,000 (32%), followed by under Rp100,000 (25%), Rp500,000 to Rp1,500,000 (17%), Rp1,500,000 to Rp5,000,000 (7%), and over Rp5,000,000 (1%). Only 18% enter with a Rp0 budget (purely window shopping). This reveals that ticket fees are viewed not as an entry barrier, but as an advance investment that visitors expect to offset through tangible product value, giveaways, or event-exclusive price advantages.
The Omnichannel Conversion Journey
According to survey findings on purchasing behavior, offline events function as a physical testing ground within an omnichannel buying process. A significant 48% of respondents state that they try products at the event but buy them later on e-commerce platforms (seeking lower prices, twin-date deals, or free shipping). In contrast, 30% buy on-site immediately due to event-exclusive promos, 12% try at the event then purchase at official physical stores later, and 10% browse without purchase intent. This establishes that physical events function heavily as mid-funnel discovery hubs, where product touch-and-feel drives conversion even when the final transaction migrates to digital channels.
Part 2: Logistics, Experience, and Satisfaction Drivers
Engagement Duration and Cashless Adoption
The standard duration of visit for 54% of attendees spans 1 to 3 hours, while 31% spend a brief visit under 1 hour. Longer visits of 3 to 5 hours account for 12%, and full-day visits over 5 hours represent 3%.
Payment preferences lean strongly digital: 61% express complete comfort with 100% cashless venues (QRIS/Cards), 21% feel neutral, 12% strongly dislike cashless systems (preferring cash options), and 6% respondents feel frustrated with cashless payment due to weak signal or QRIS errors. With 85% spending 3 hours or less and 61% favoring cashless setups, visitors value operational efficiency, favoring streamlined venues that maximize exploration within a tight time window.
Pain Points and Areas for Improvement
When evaluating main pain points (multiple choice), high prices for food/items lead at 31%, followed by difficult or expensive parking/transport access (26%), excessive crowd and disorganized queues (25%), admission fees (19%), lack of public facilities like rest areas or clean toilets (19%), far venue locations (15%), and warm/uncomfortable venue temperatures (14%).
To address these issues, attendees prioritize key organizer improvements (multiple choice): queue management and visitor capping lead at 37%, followed by public transport access and transparent parking rates (34%), clean toilets and adequate rest areas (29%), venue signage and safety (26%), and stable internet connection for cashless transactions (17%). The direct alignment between top complaints (overwhelming crowd, parking, overpriced foods) and requested organizer improvement areas highlights that logistical friction directly threatens on-site visit time and purchasing willingness.
Future Event Preferences and Repeat Attendance Drivers
When asked what types of offline events respondents would definitely visit again in the future (multiple choice), price-driven and community-focused concepts lead to repeat demand. Events prioritizing steep discounts and flash sales lead as the top pull factor for 44% of respondents. Strong community-based events (bringing together hobbyists and shared-interest groups) rank second at 32%, followed by all-in-one event concepts combining shopping, culinary stalls, and live entertainment at 25%. Furthermore, 18% want events offering rare products unavailable online, 15% demand exclusive, quota-capped venues to prevent overcrowding, and 14% prefer interactive events with hands-on activities, workshops, or games. This proves that repeat attendance is driven by a dual formula: delivering undeniable commercial incentive (clearance sales) while fostering shared-interest social environments.
Part 3: Deep-Dive Sector Analysis
Overview of Category Interest and Event Popularity
To understand sector-specific visitor engagement, respondents selected up to four offline event categories they visit most frequently or find most appealing (multiple choice). The data reveals that lifestyle and personal interest categories command the highest foot traffic and consumer draw.
Fashion and Lifestyle leads as the most visited event category, captured by 47% of respondents, closely followed by Culinary/FnB Festivals at 43%. Beauty and Cosmetics (35%) and Books & Literacy (34%) also represent major traffic magnets. Consumer tech and physical wellness maintain strong appeal through Tech & Gadget (29%) and Sports & Health (28%). Meanwhile, specialized lifestyle interests round out the spectrum through Hobby, Pop Culture, & Pet (18%), Automotive (13%), and Moms, Baby, & Kids (11%). This breakdown demonstrates that broad consumer lifestyle categories generate the highest baseline reach, while specialized sectors achieve deep conversion through targeted interest.
The following sub-sections examine visitor motivations and direct purchase triggers across each individual event category.
Fashion Events
Examples: Brightspot Market, JakCloth, UrbanSneakerSociety, Indonesia Fashion Week, etc.
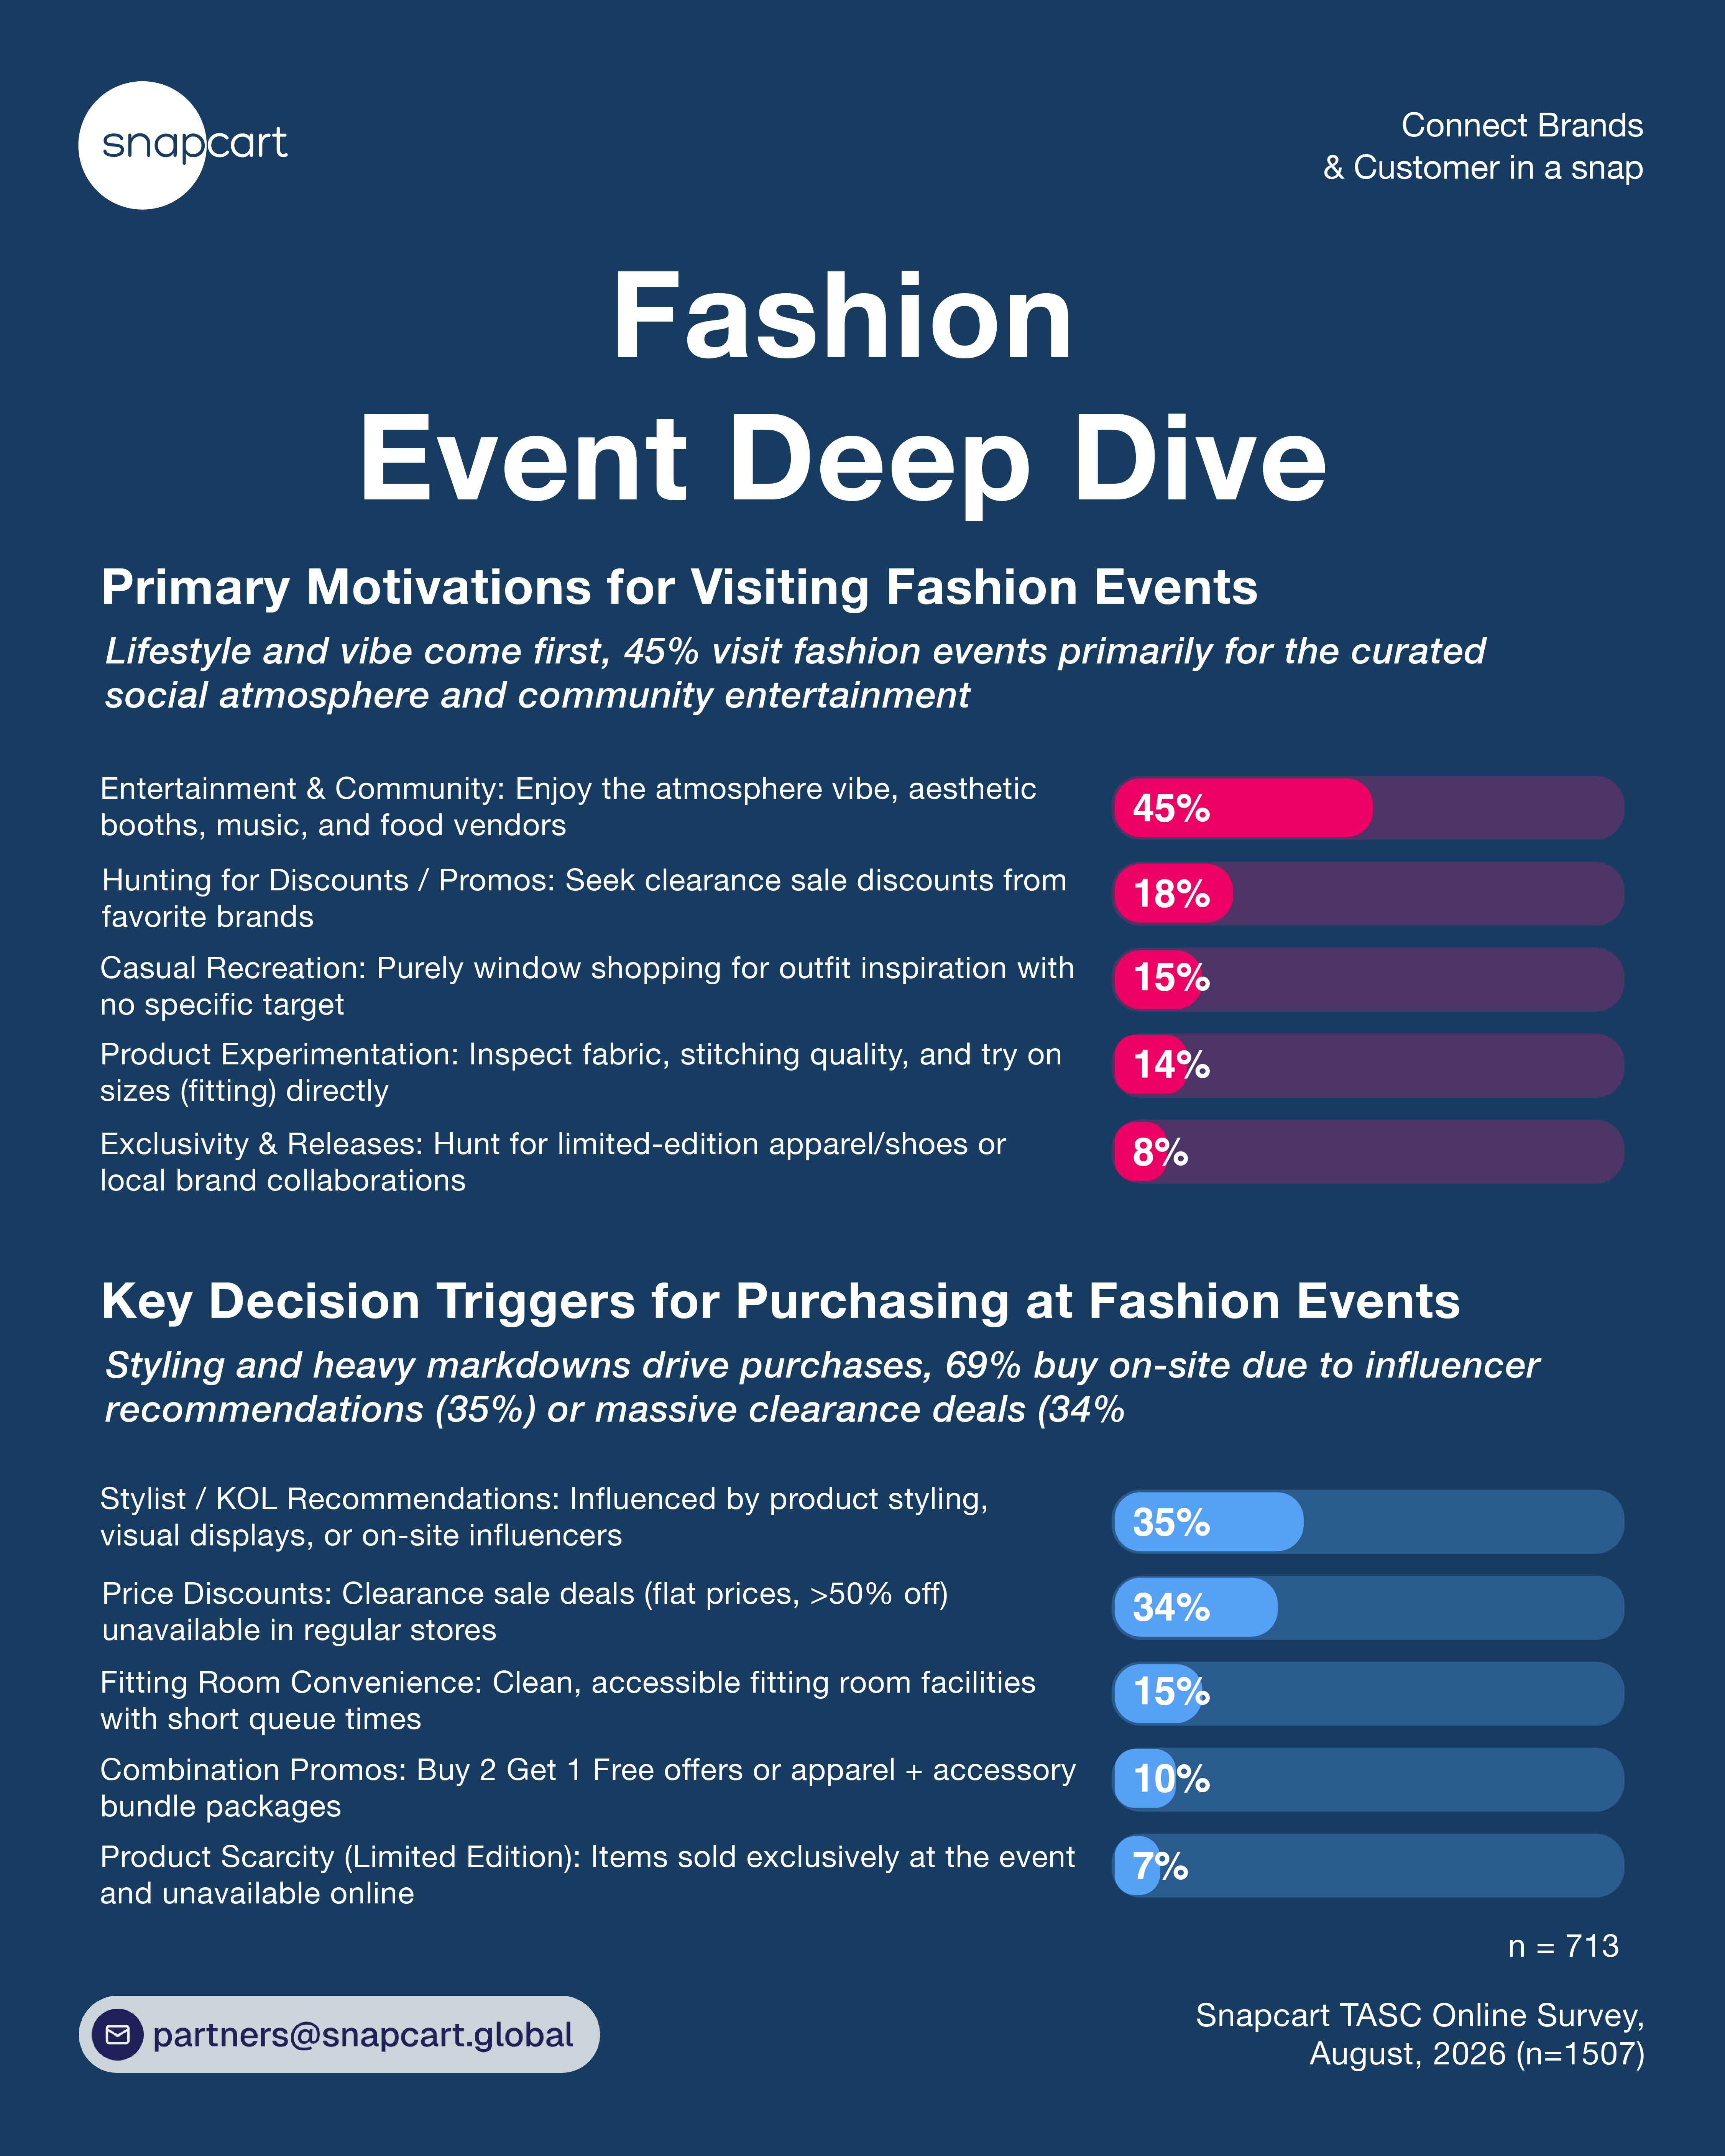
Atmosphere and community vibe lead fashion attendance at 45%, outranking hunting for discounts and promos (18%), casual recreation (15%), inspect fabric and fitting room try-on (14%), and limited-edition brand collaborations (8%). Direct purchases are heavily influenced by stylist/KOL product presentation (35%) and price discounts unavailable in regular stores (34%), followed by clean fitting room availability (15%), buy-2-get-1 promos (10%), and event-exclusive product scarcity (7%). This reveals that fashion is fundamentally an identity-driven category; consumers attend primarily for social validation and multisensory atmosphere, where aspirational visual styling from influencers and peers effectively converts lifestyle foot traffic into on-site sales.
Culinary Events
Examples: Festival Jajanan Bango, PergiKuliner Festival, FnB Expo, etc
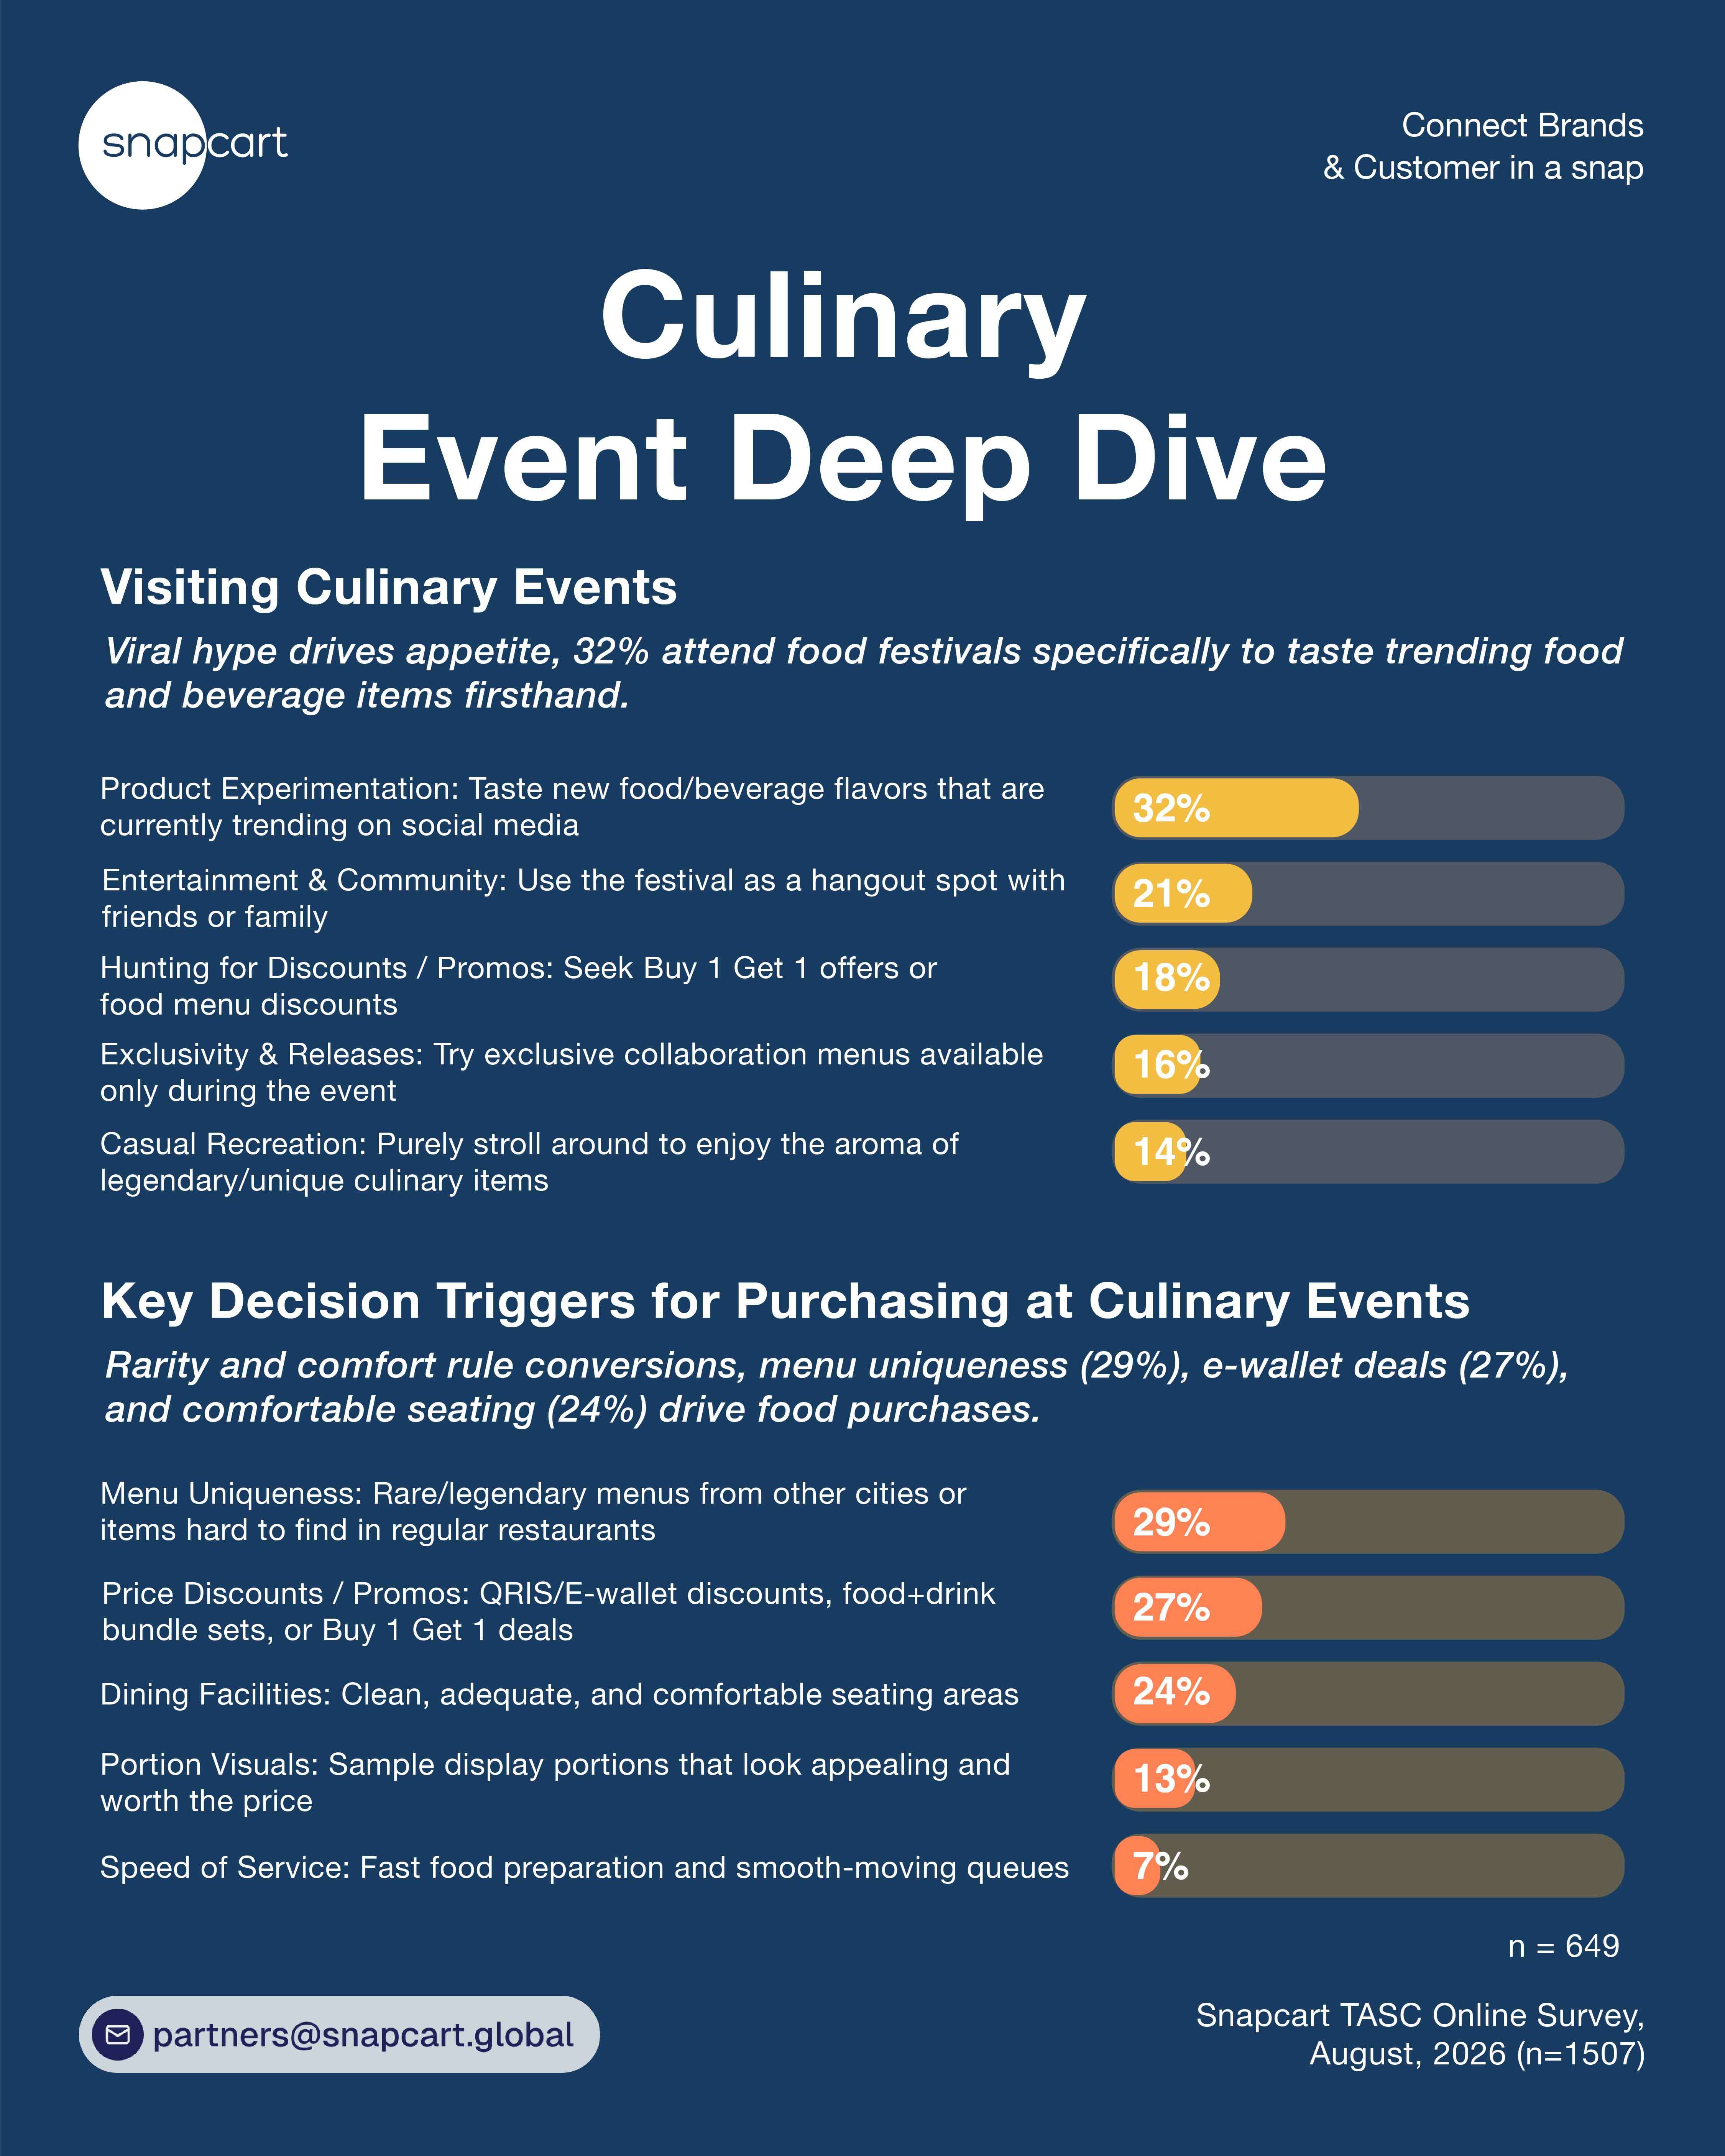
Taste viral food trends leads to motivation for 32% of food festival visitors, followed by social hangouts (21%), price promos (18%), menus available only during the event (16%), and casual strolling (14%). On-site purchase triggers include menu uniqueness/regional scarcity (29%), QRIS/e-wallet cashback promos (27%), clean seating area availability (24%), portion display transparency (13%), and fast serving speeds (7%). This underscores that impulse food purchases depend on product scarcity and viral trendiness, but smooth payment tech and comfortable seating environments are essential to maximize basket size and repeat orders.
Beauty & Cosmetics Events
Examples: Jakarta X Beauty, BFF Festival, BeautyHaul Mart, etc.
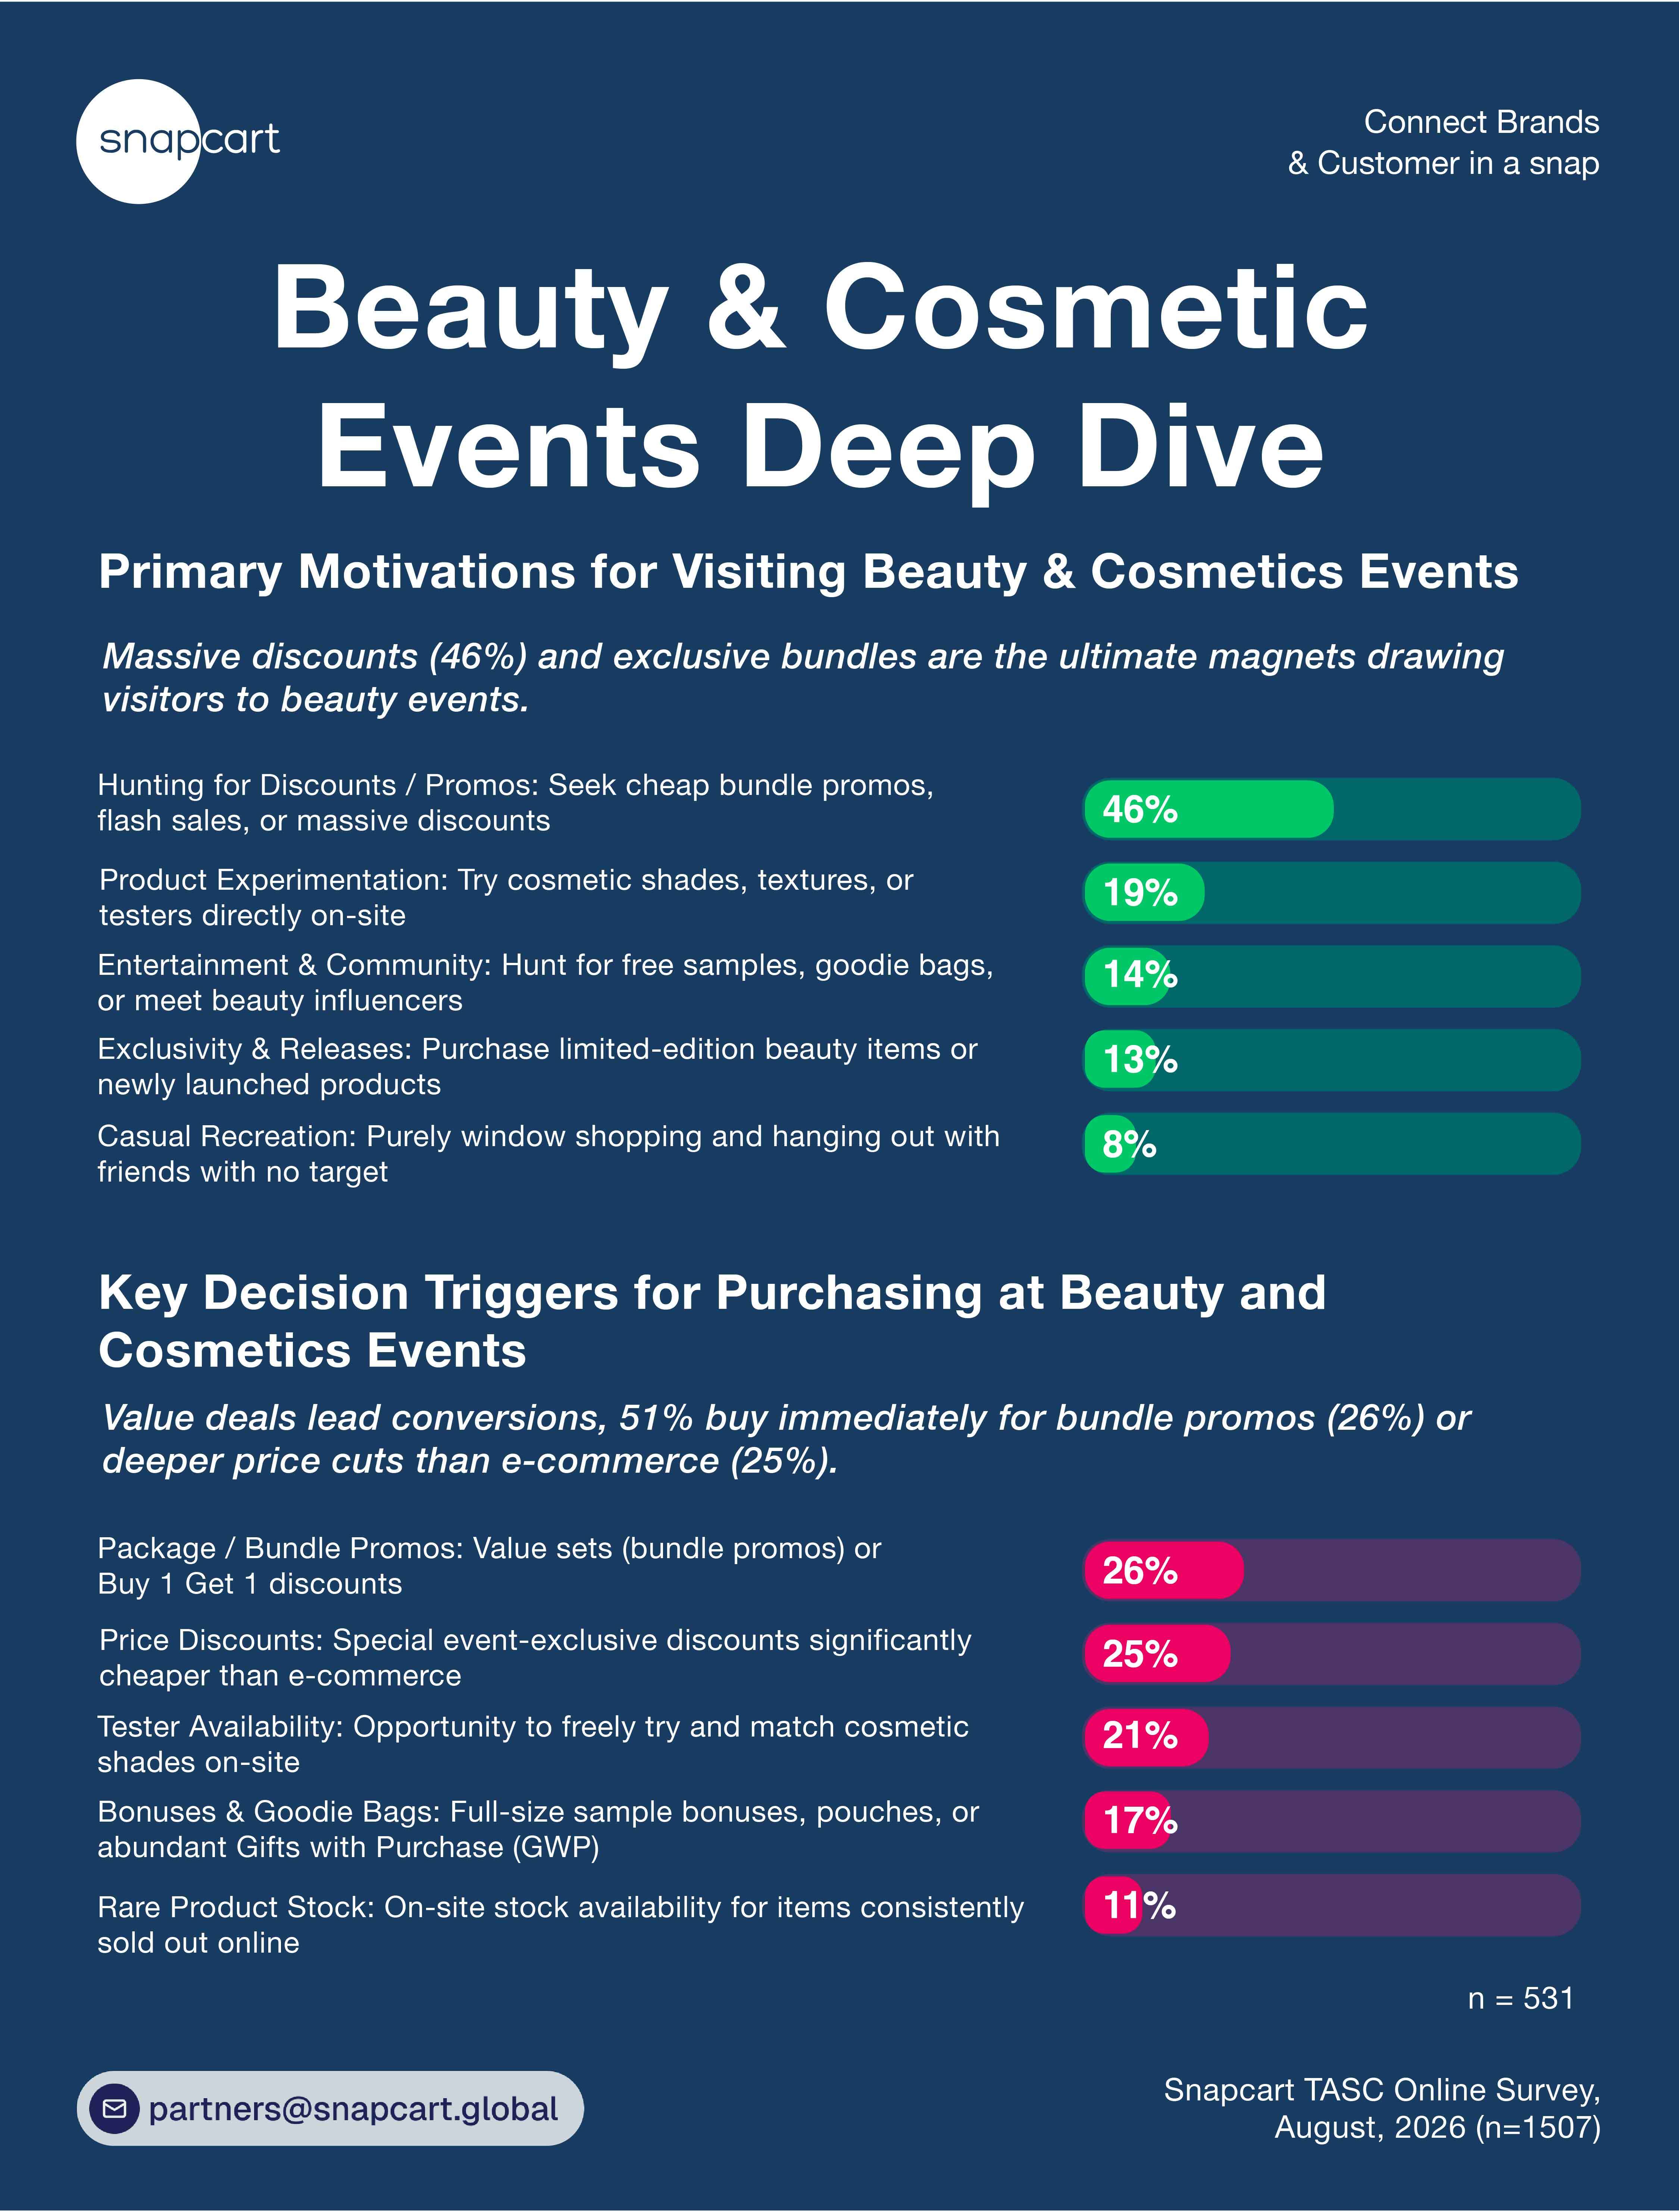
Hunting for discounts and promos is the leading driver for 46% of beauty event attendees seeking bundle promos and flash sales, followed by shade/texture testing (19%), hunting free samples/influencer meetups (14%), exclusive/new brand releases (13%), and casual recreation (8%). Purchase conviction is triggered by package/bundle promos (26%), price cuts below e-commerce prices (25%), on-site tester availability (21%), free samples/GWP (17%), and rare/sold-out stock availability (11%). This indicates that while direct price incentives attract beauty consumers to the booth, pairing immediate volume savings (bundles/discounts) with ability to do try shades in real life eliminates online purchase doubt to convert visits into instant transactions.
Books & Literacy Events
Examples: Big Bad Wolf (BBW), Indonesia International Book Fair (IIBF), Patjarmerah, etc.
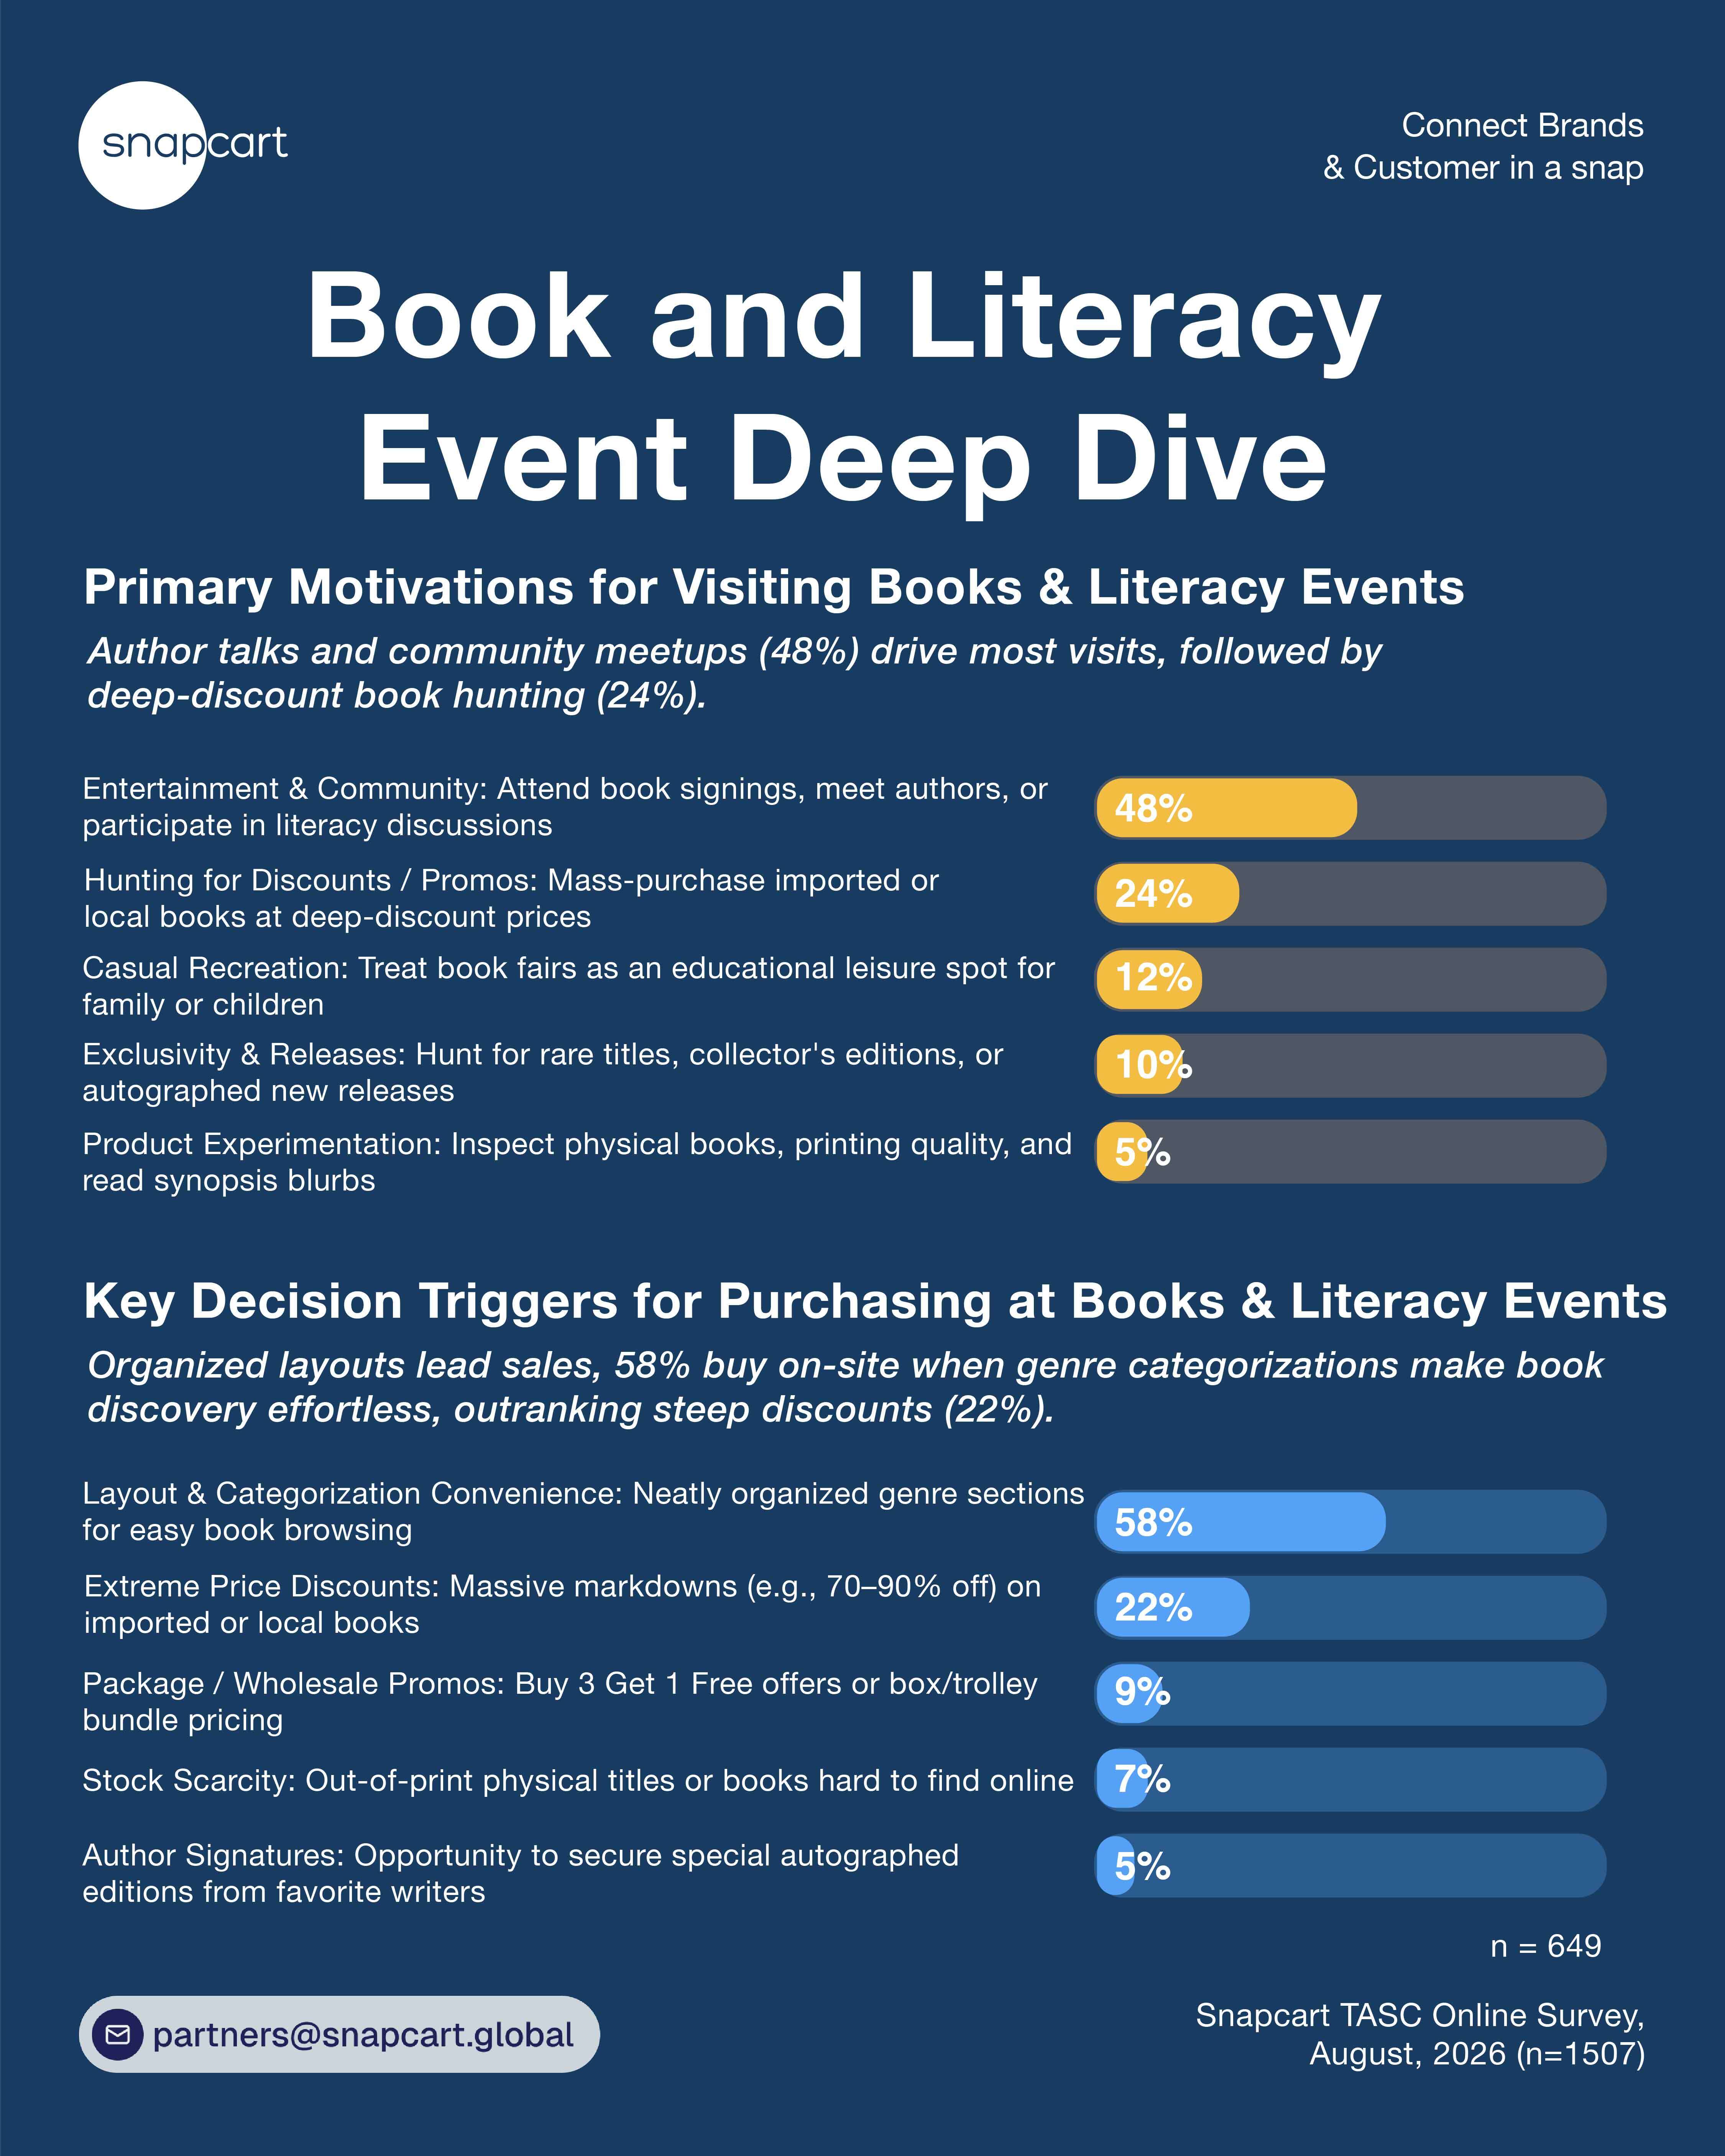
Attending author sessions, book signings, and literacy discussions is the top driver for 48% of literacy event visitors, outperforming book hunting for discounts (24%), family educational recreation (12%), browsing rare/autographed editions (10%), and inspecting physical book quality (5%). Conversions are overwhelmingly triggered by clear, genre-based booth organization (58%), extreme price discounts of 70–90% (22%), bundle/wholesale pricing (9%), out-of-print title availability (7%), and author signings (5%). This highlights that while event-wide discounts draw visitors to the venue, clear and well-organized genre categorization serves as a critical friction-reducer that drives final purchase decisions, as it allows respondents to effortlessly find their desired books without confusion.
Tech & Gadget Events
Examples: Indocomtech, Electronic City Expo, Erafone Fair, Jakarta Notebook Expo, etc.
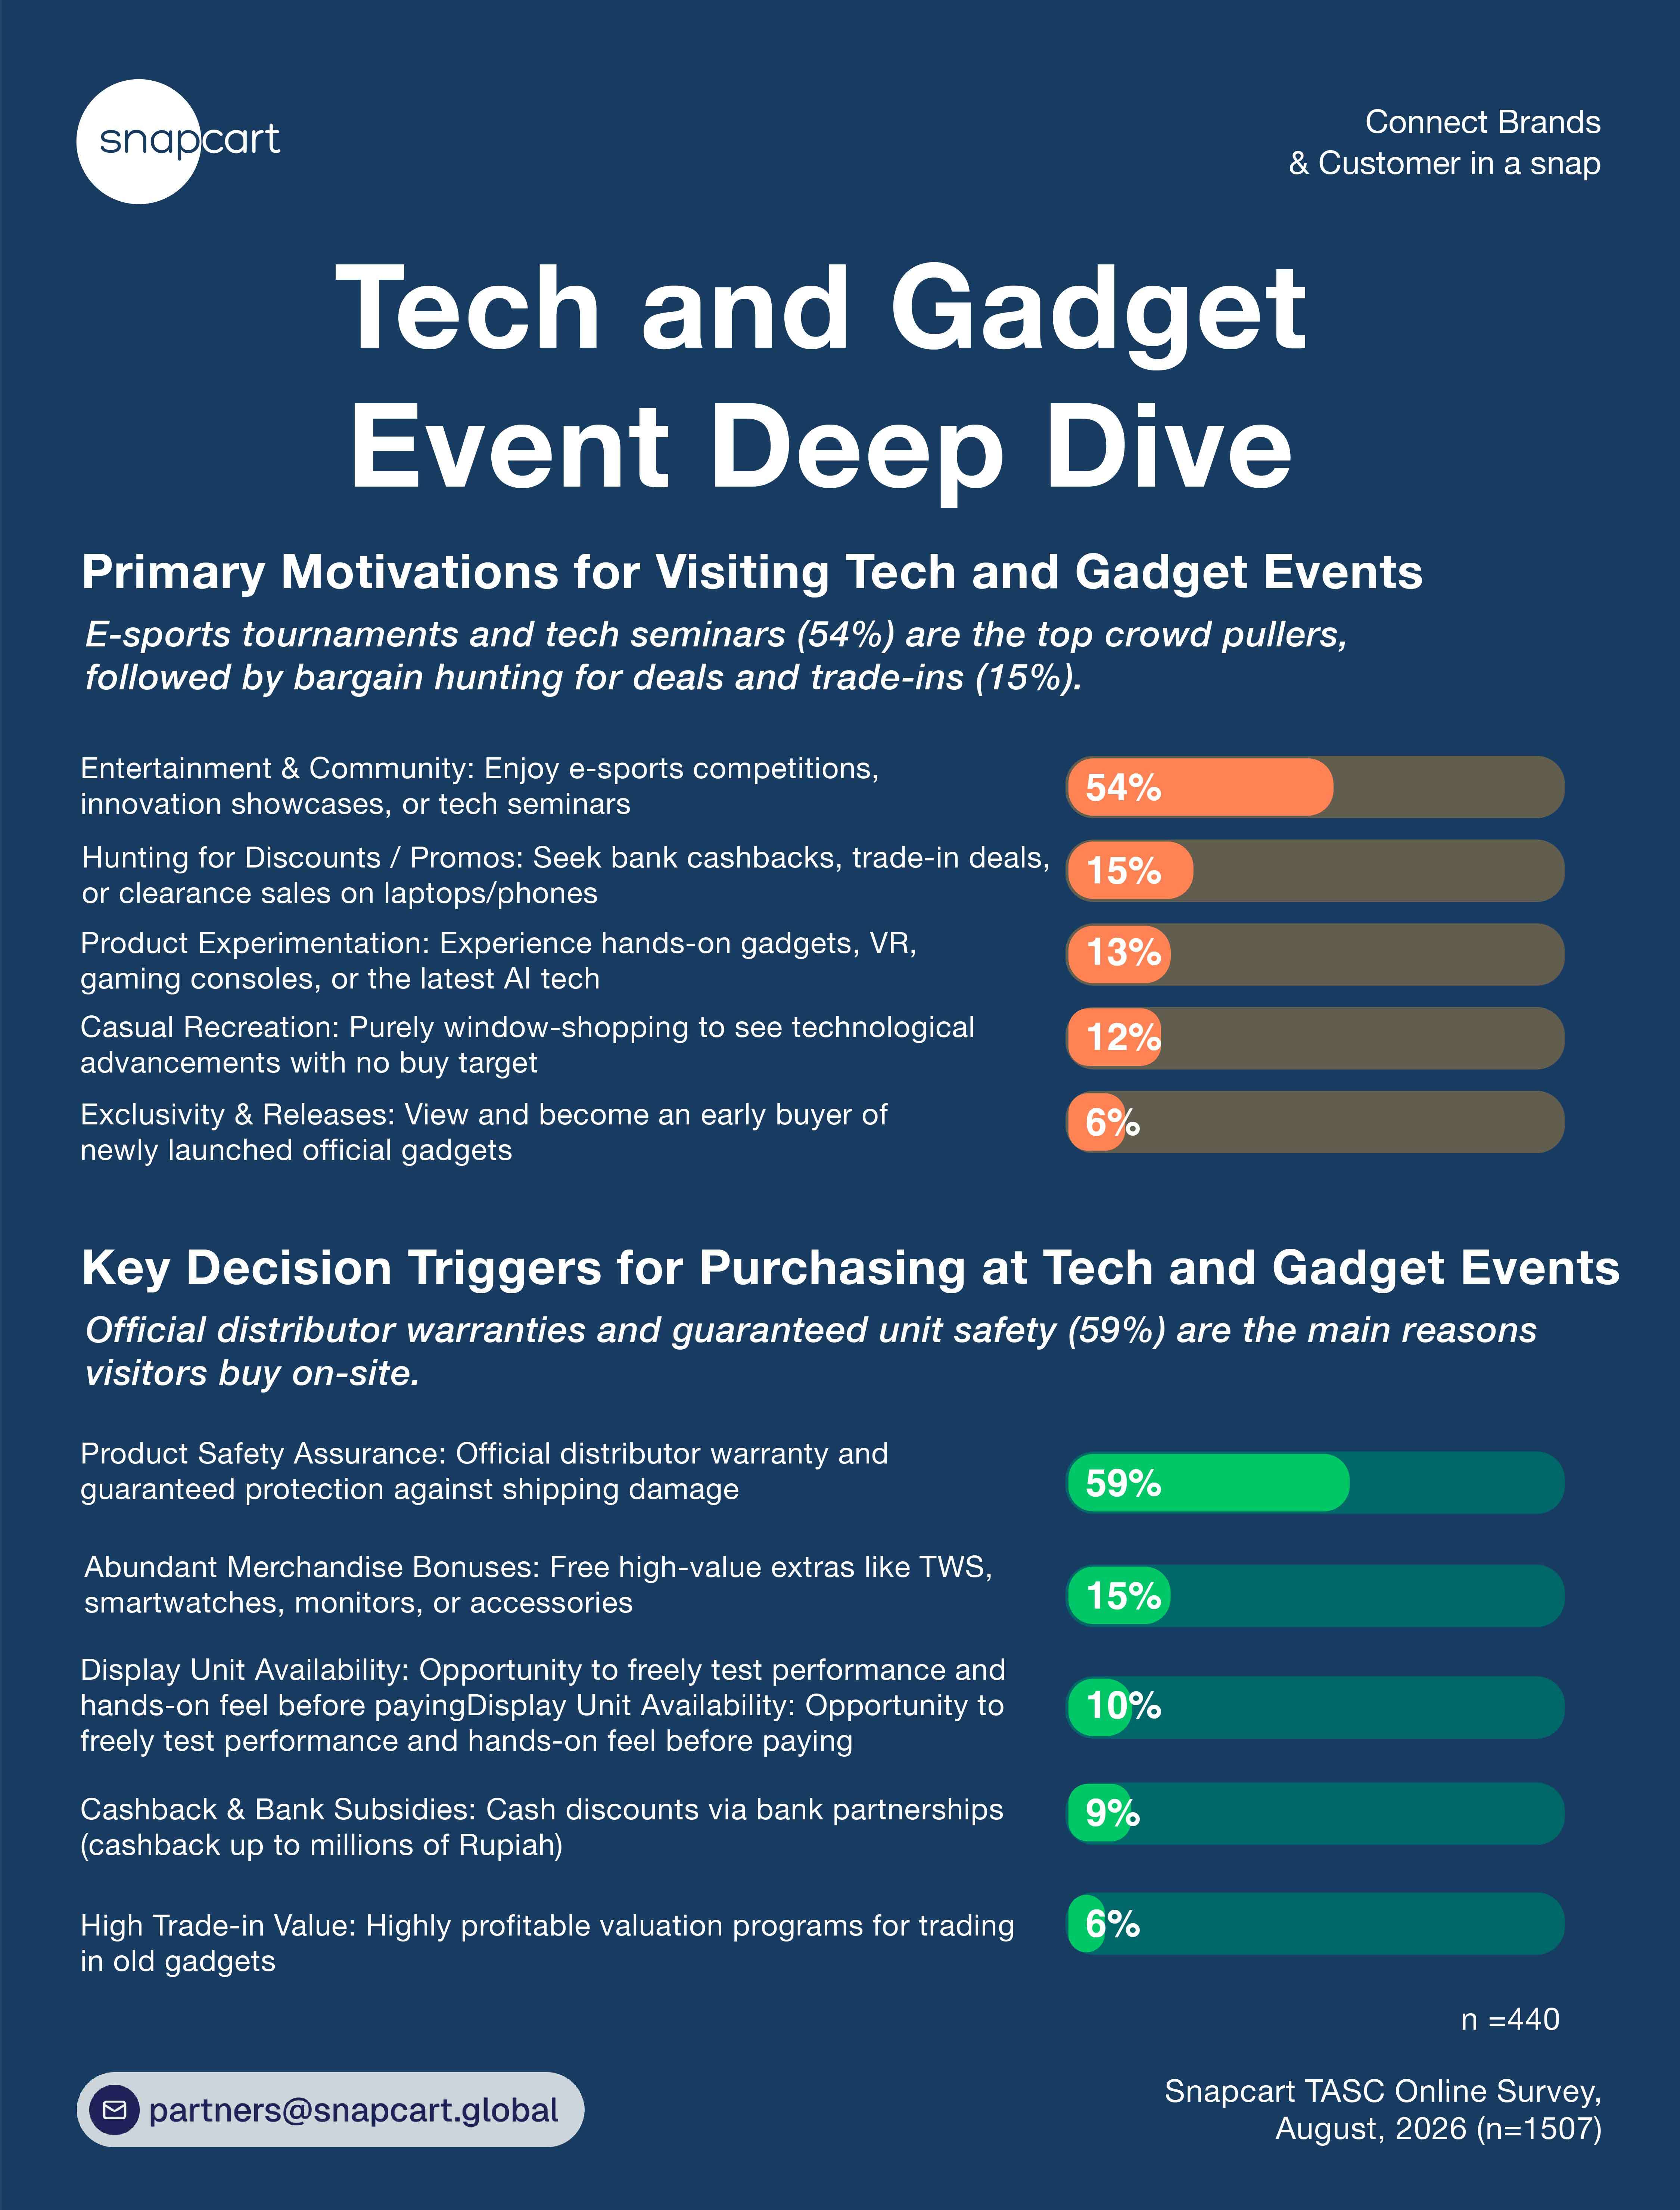
E-sports competitions, innovation showcases, and tech seminars draw 54% of tech expo visitors, outstripping trade-in/clearance hunting (15%), product testing/VR (13%), casual recreation (12%), and first-buyer releases (6%). On-site purchase triggers are dominated by official distributor warranty guarantees and shipping-damage protection (59%), high-value merchandise bonuses (15%), display unit testing (10%), bank cashbacks (9%), and high trade-in valuations (6%). This proves that while interactive entertainment attracts large tech crowds, risk mitigation and post-purchase security outweigh immediate financial incentives when converting high-ticket gadget shoppers.
Sports & Health Events
Examples: Indonesia Sports and Fitness Expo, Marathon/Race Expo, Yoga Fest, etc.
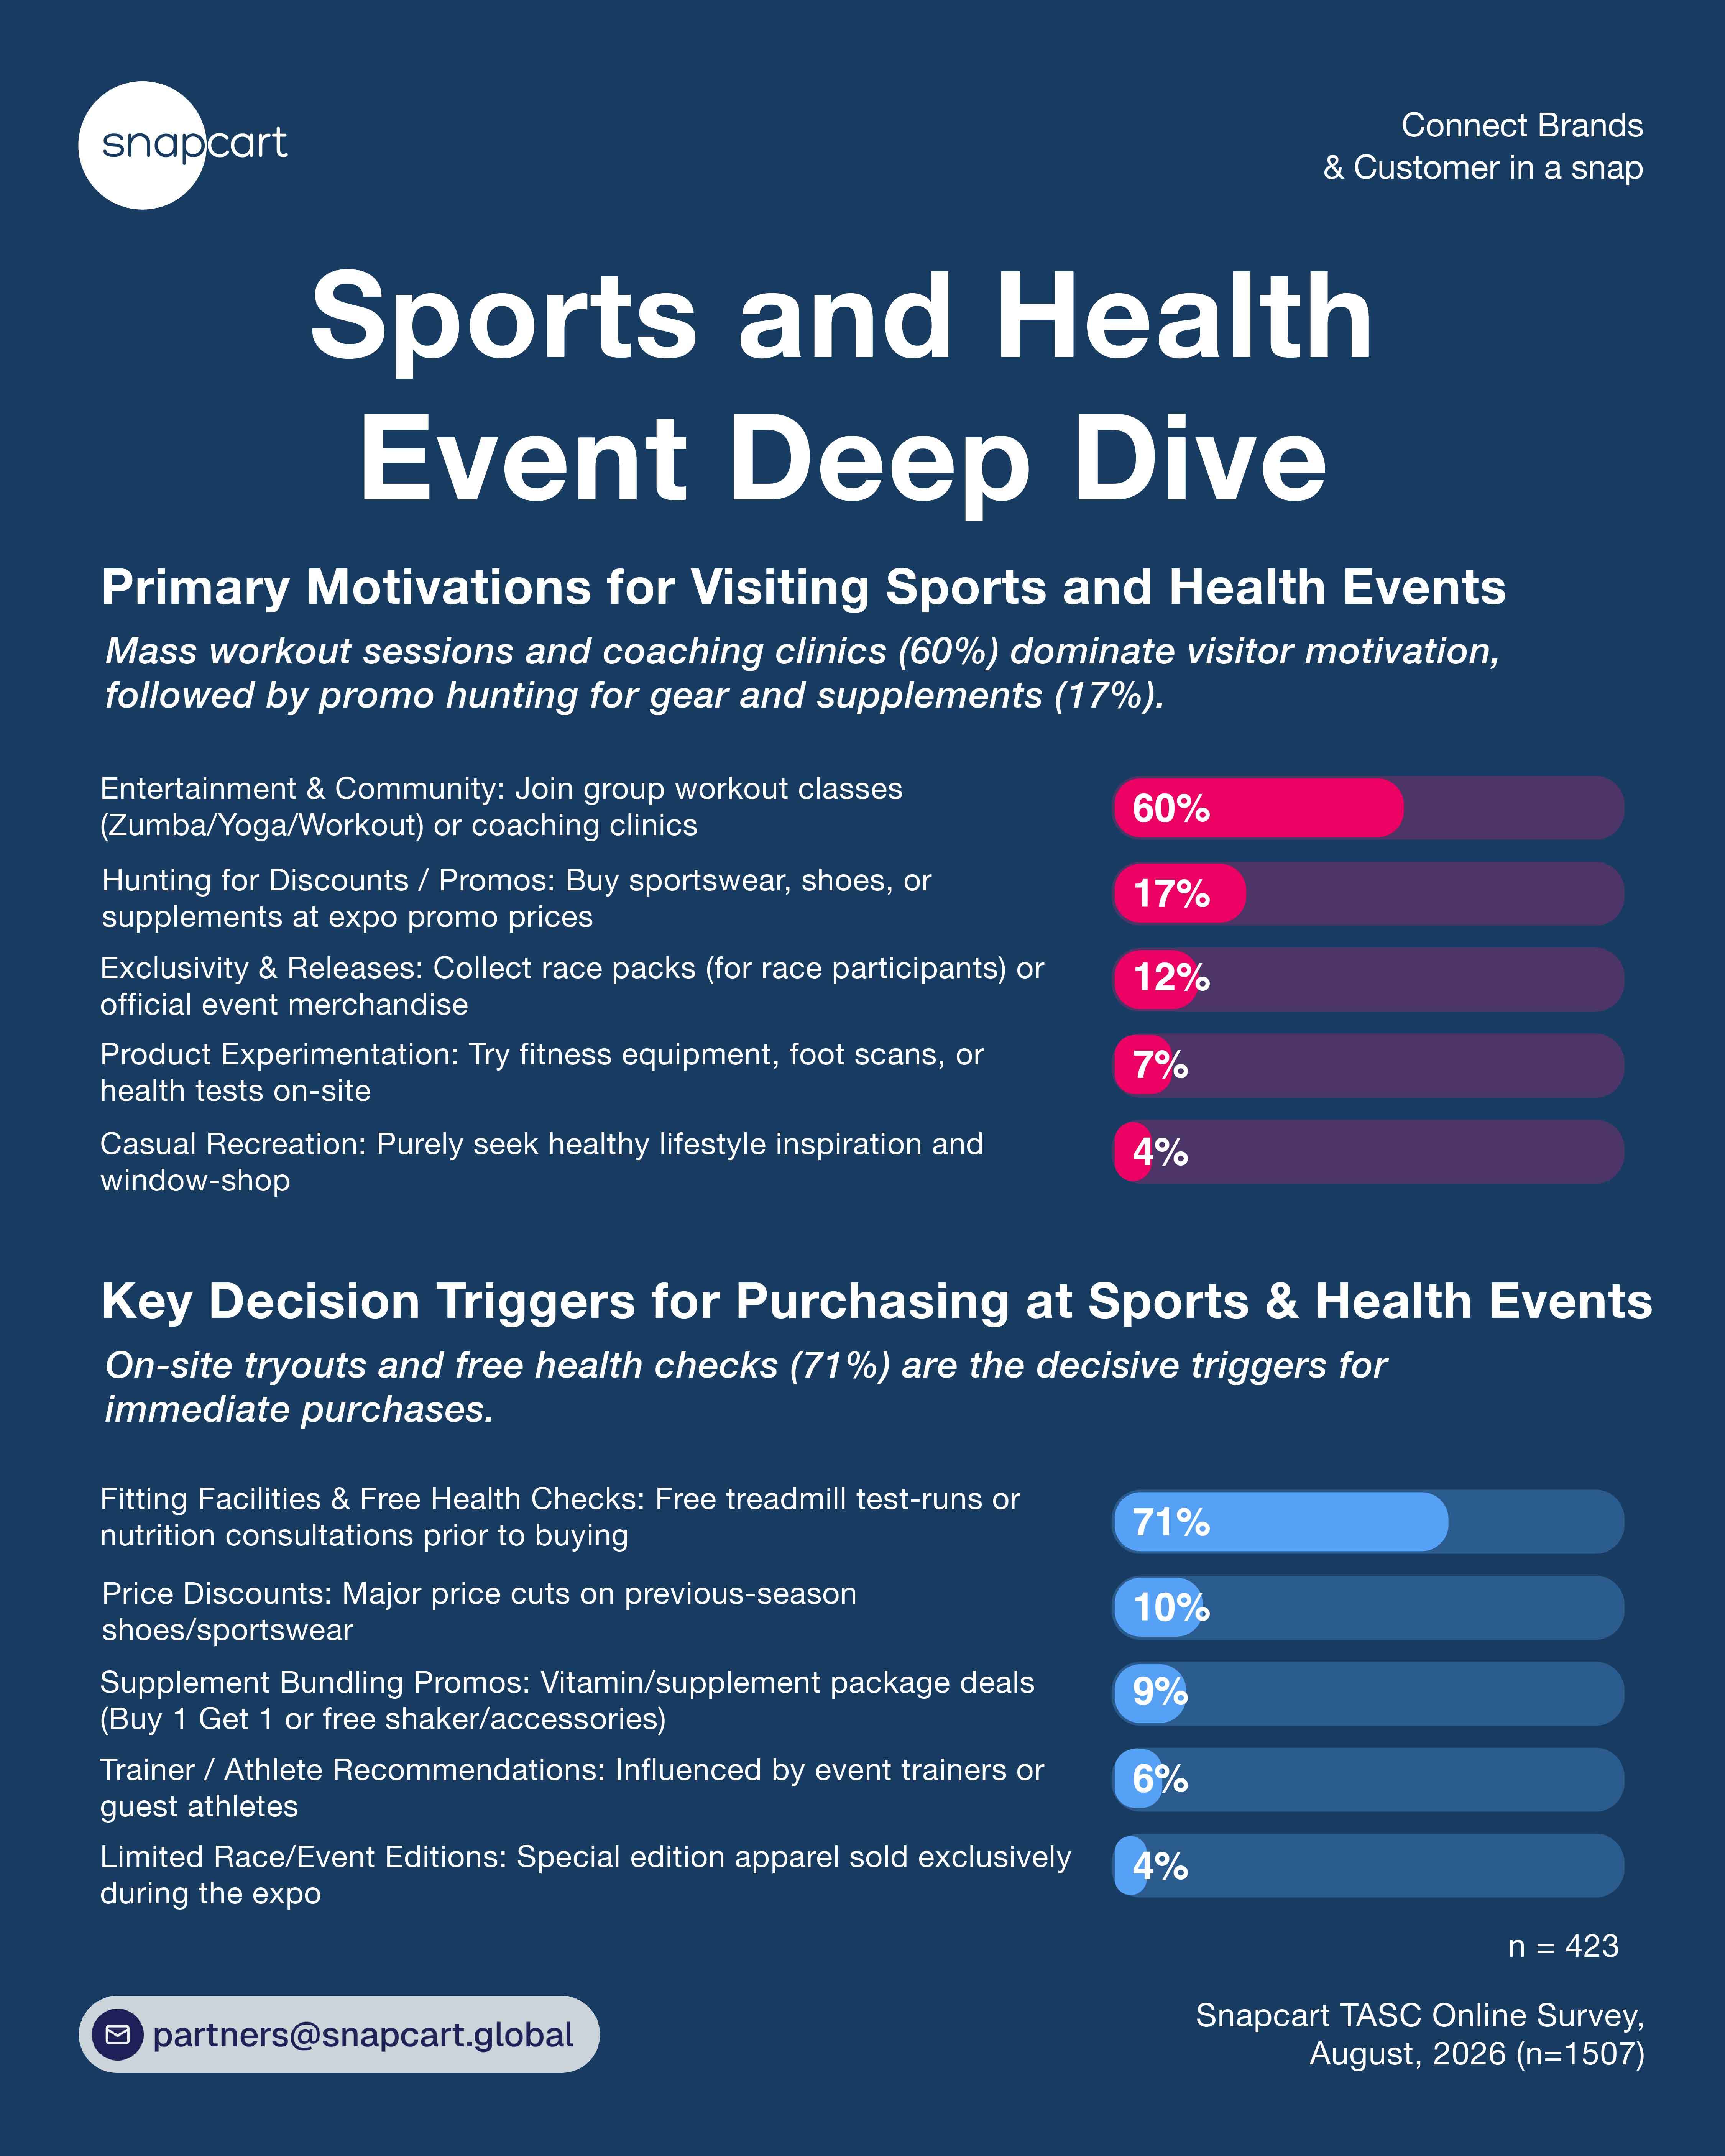
Joining group workouts (Zumba/Yoga) or coaching clinics leads motivation for 60% of sports event visitors, followed by gear promos (17%), race pack pickup/merch (12%), testing fitness equipment/health checks (7%), and casual recreation (4%). Buying conviction shows an overwhelming reliance on physical trial: free treadmill tests, foot scans, and health check facilities trigger purchases for 71% of attendees, far outranking apparel discounts (10%), supplement bundle promos (9%), trainer recommendations (6%), and race-exclusive apparel (4%). This establishes that sports consumers require direct physical and biological validation before committing to performance gear, making active trial stations vastly more persuasive than passive discounts.
Hobby, Pop Culture & Pet Events
Examples: Indonesia Comic-Con, Art Jakarta, Indonesia Pet Expo, Cosplay Fest, etc.
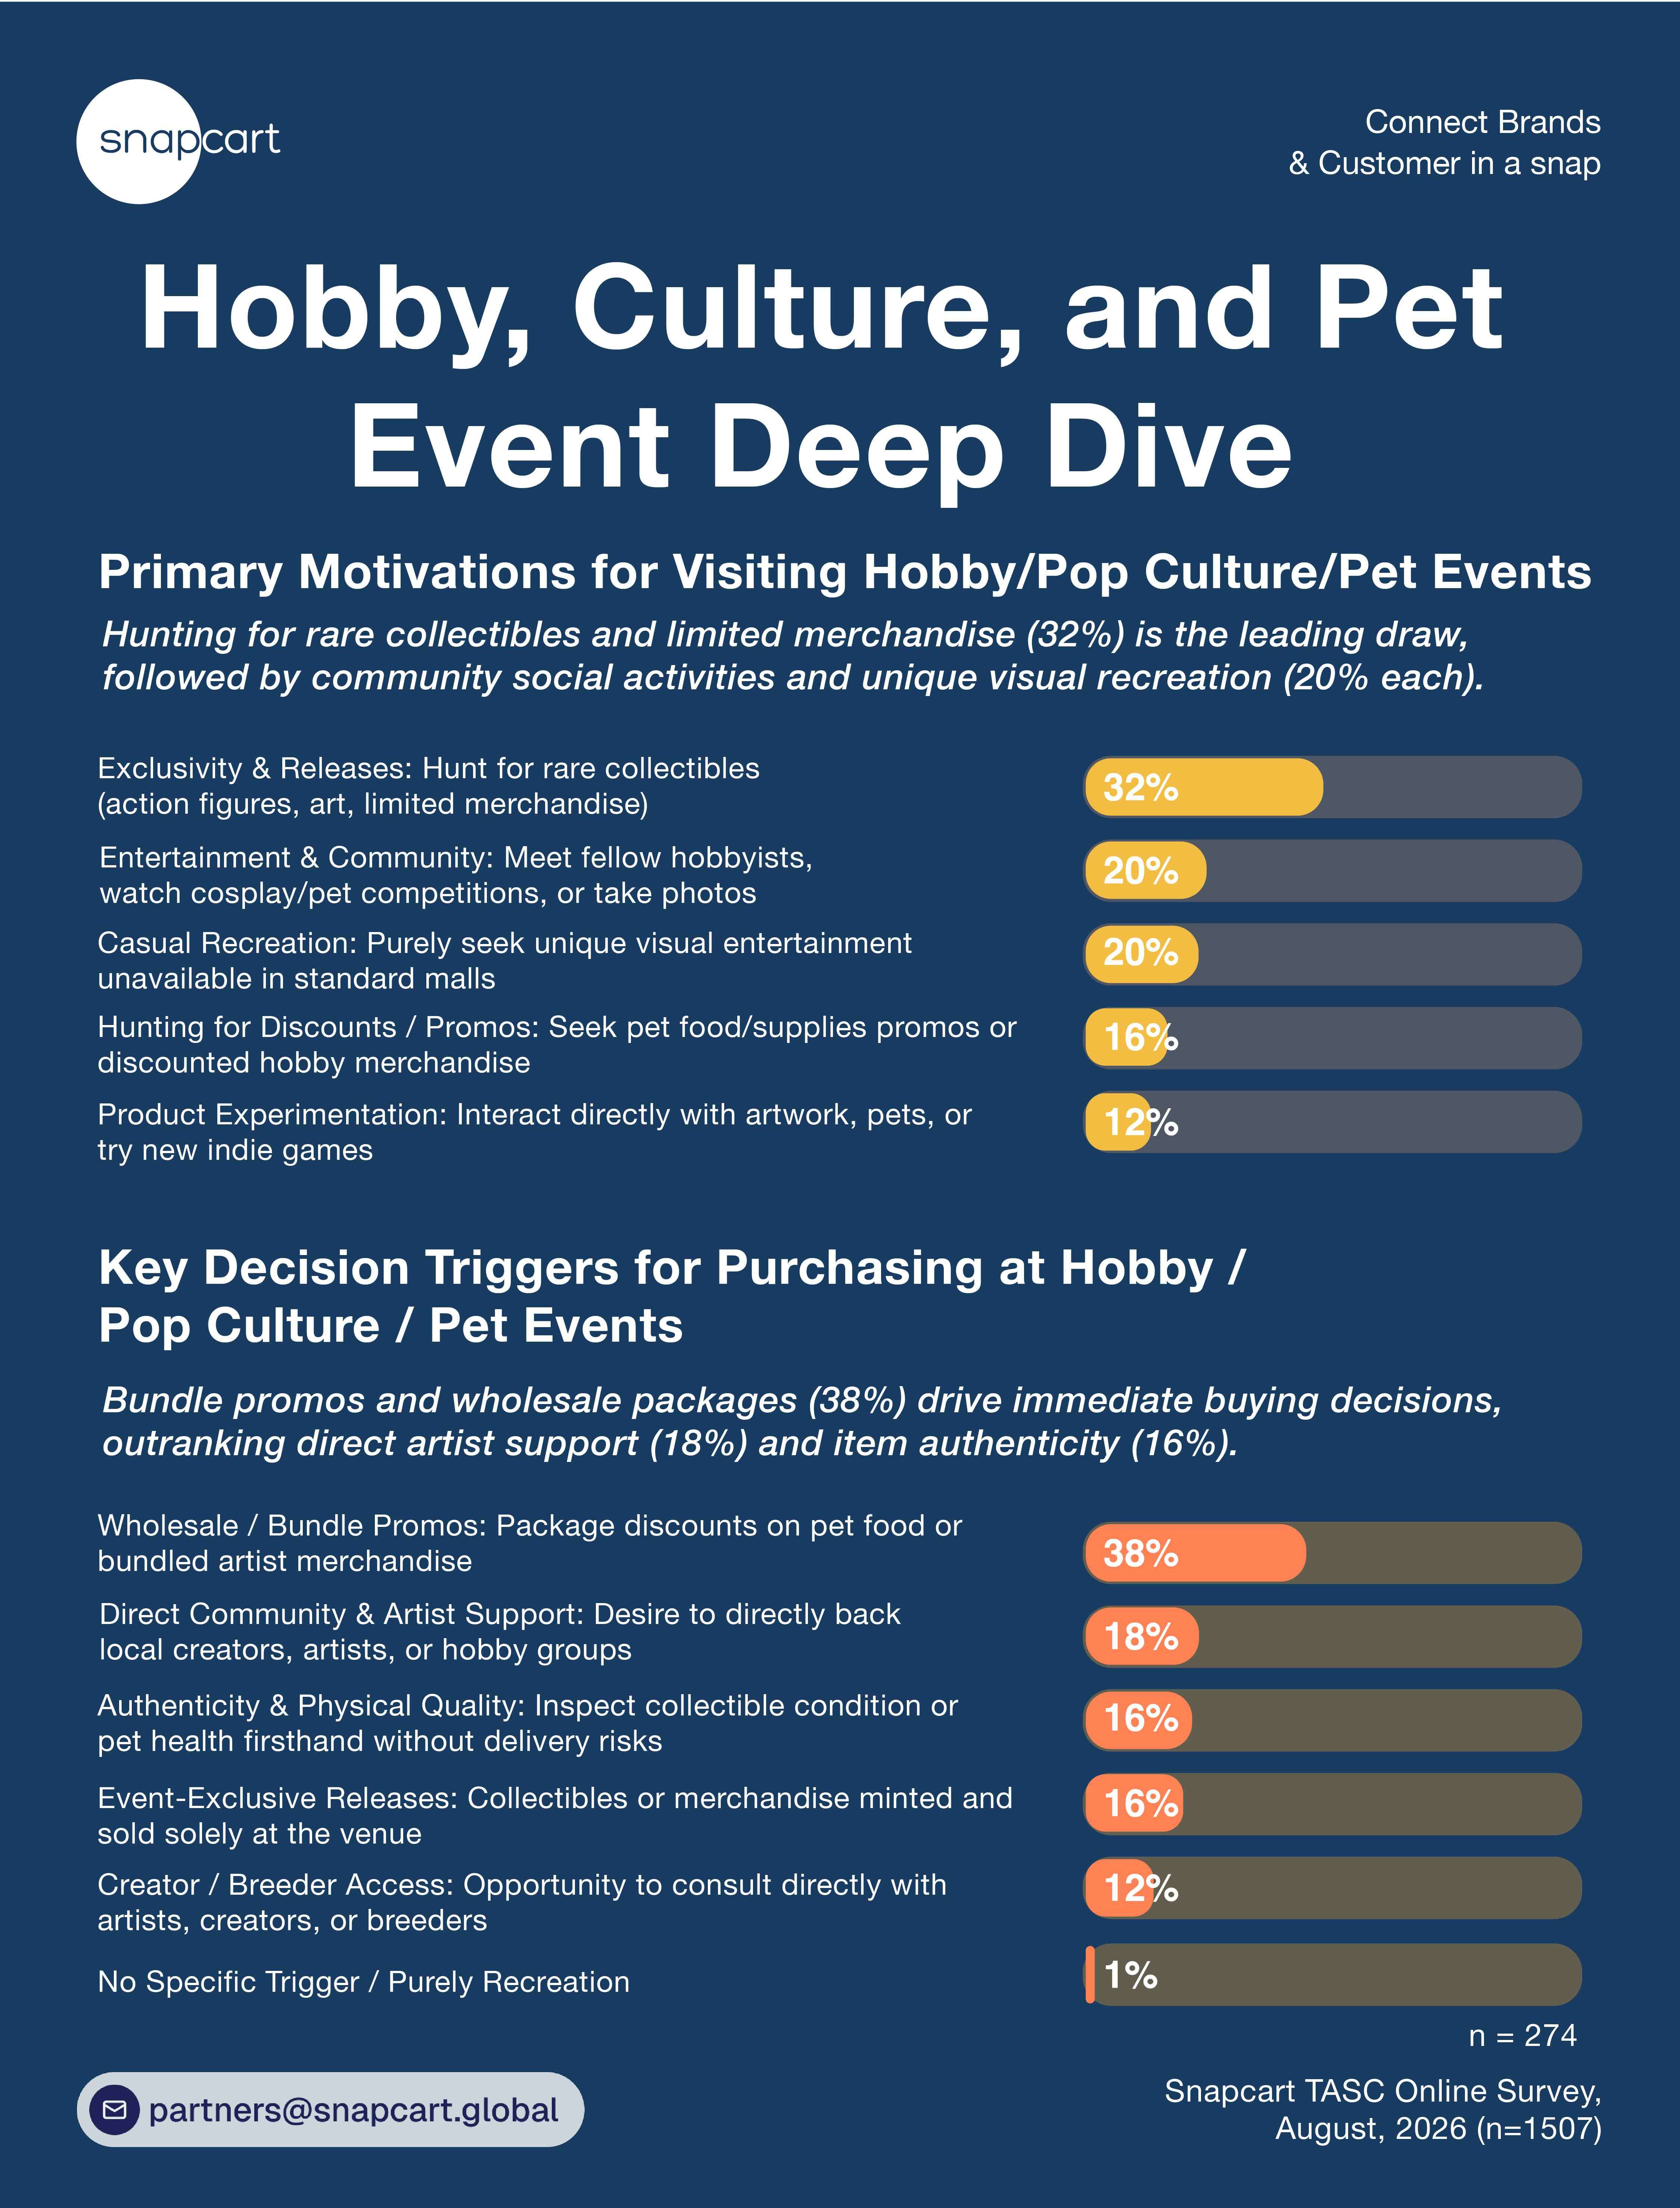
Hunting for rare collectibles, action figures, or limited merch drives 32% of hobby visitors, followed by community/cosplay entertainment (20%), visual recreation (20%), discounted pet supply/hobby merchandise (16%), and artwork/game/pet interaction (12%). Purchases are triggered by wholesale/bundle promos (38%), direct support for local creators (18%), physical item inspection (16%), event-exclusive releases (16%), and creator/breeder consultations (12%). This illustrates that passion-driven consumers prioritize bundle value and item exclusivity, reinforced by a strong emotional inclination to support local artists and niche creators directly.
Automotive Events
Examples: GIIAS, IIMS, Custom Culture, Indonesia Scooter Festival, etc.
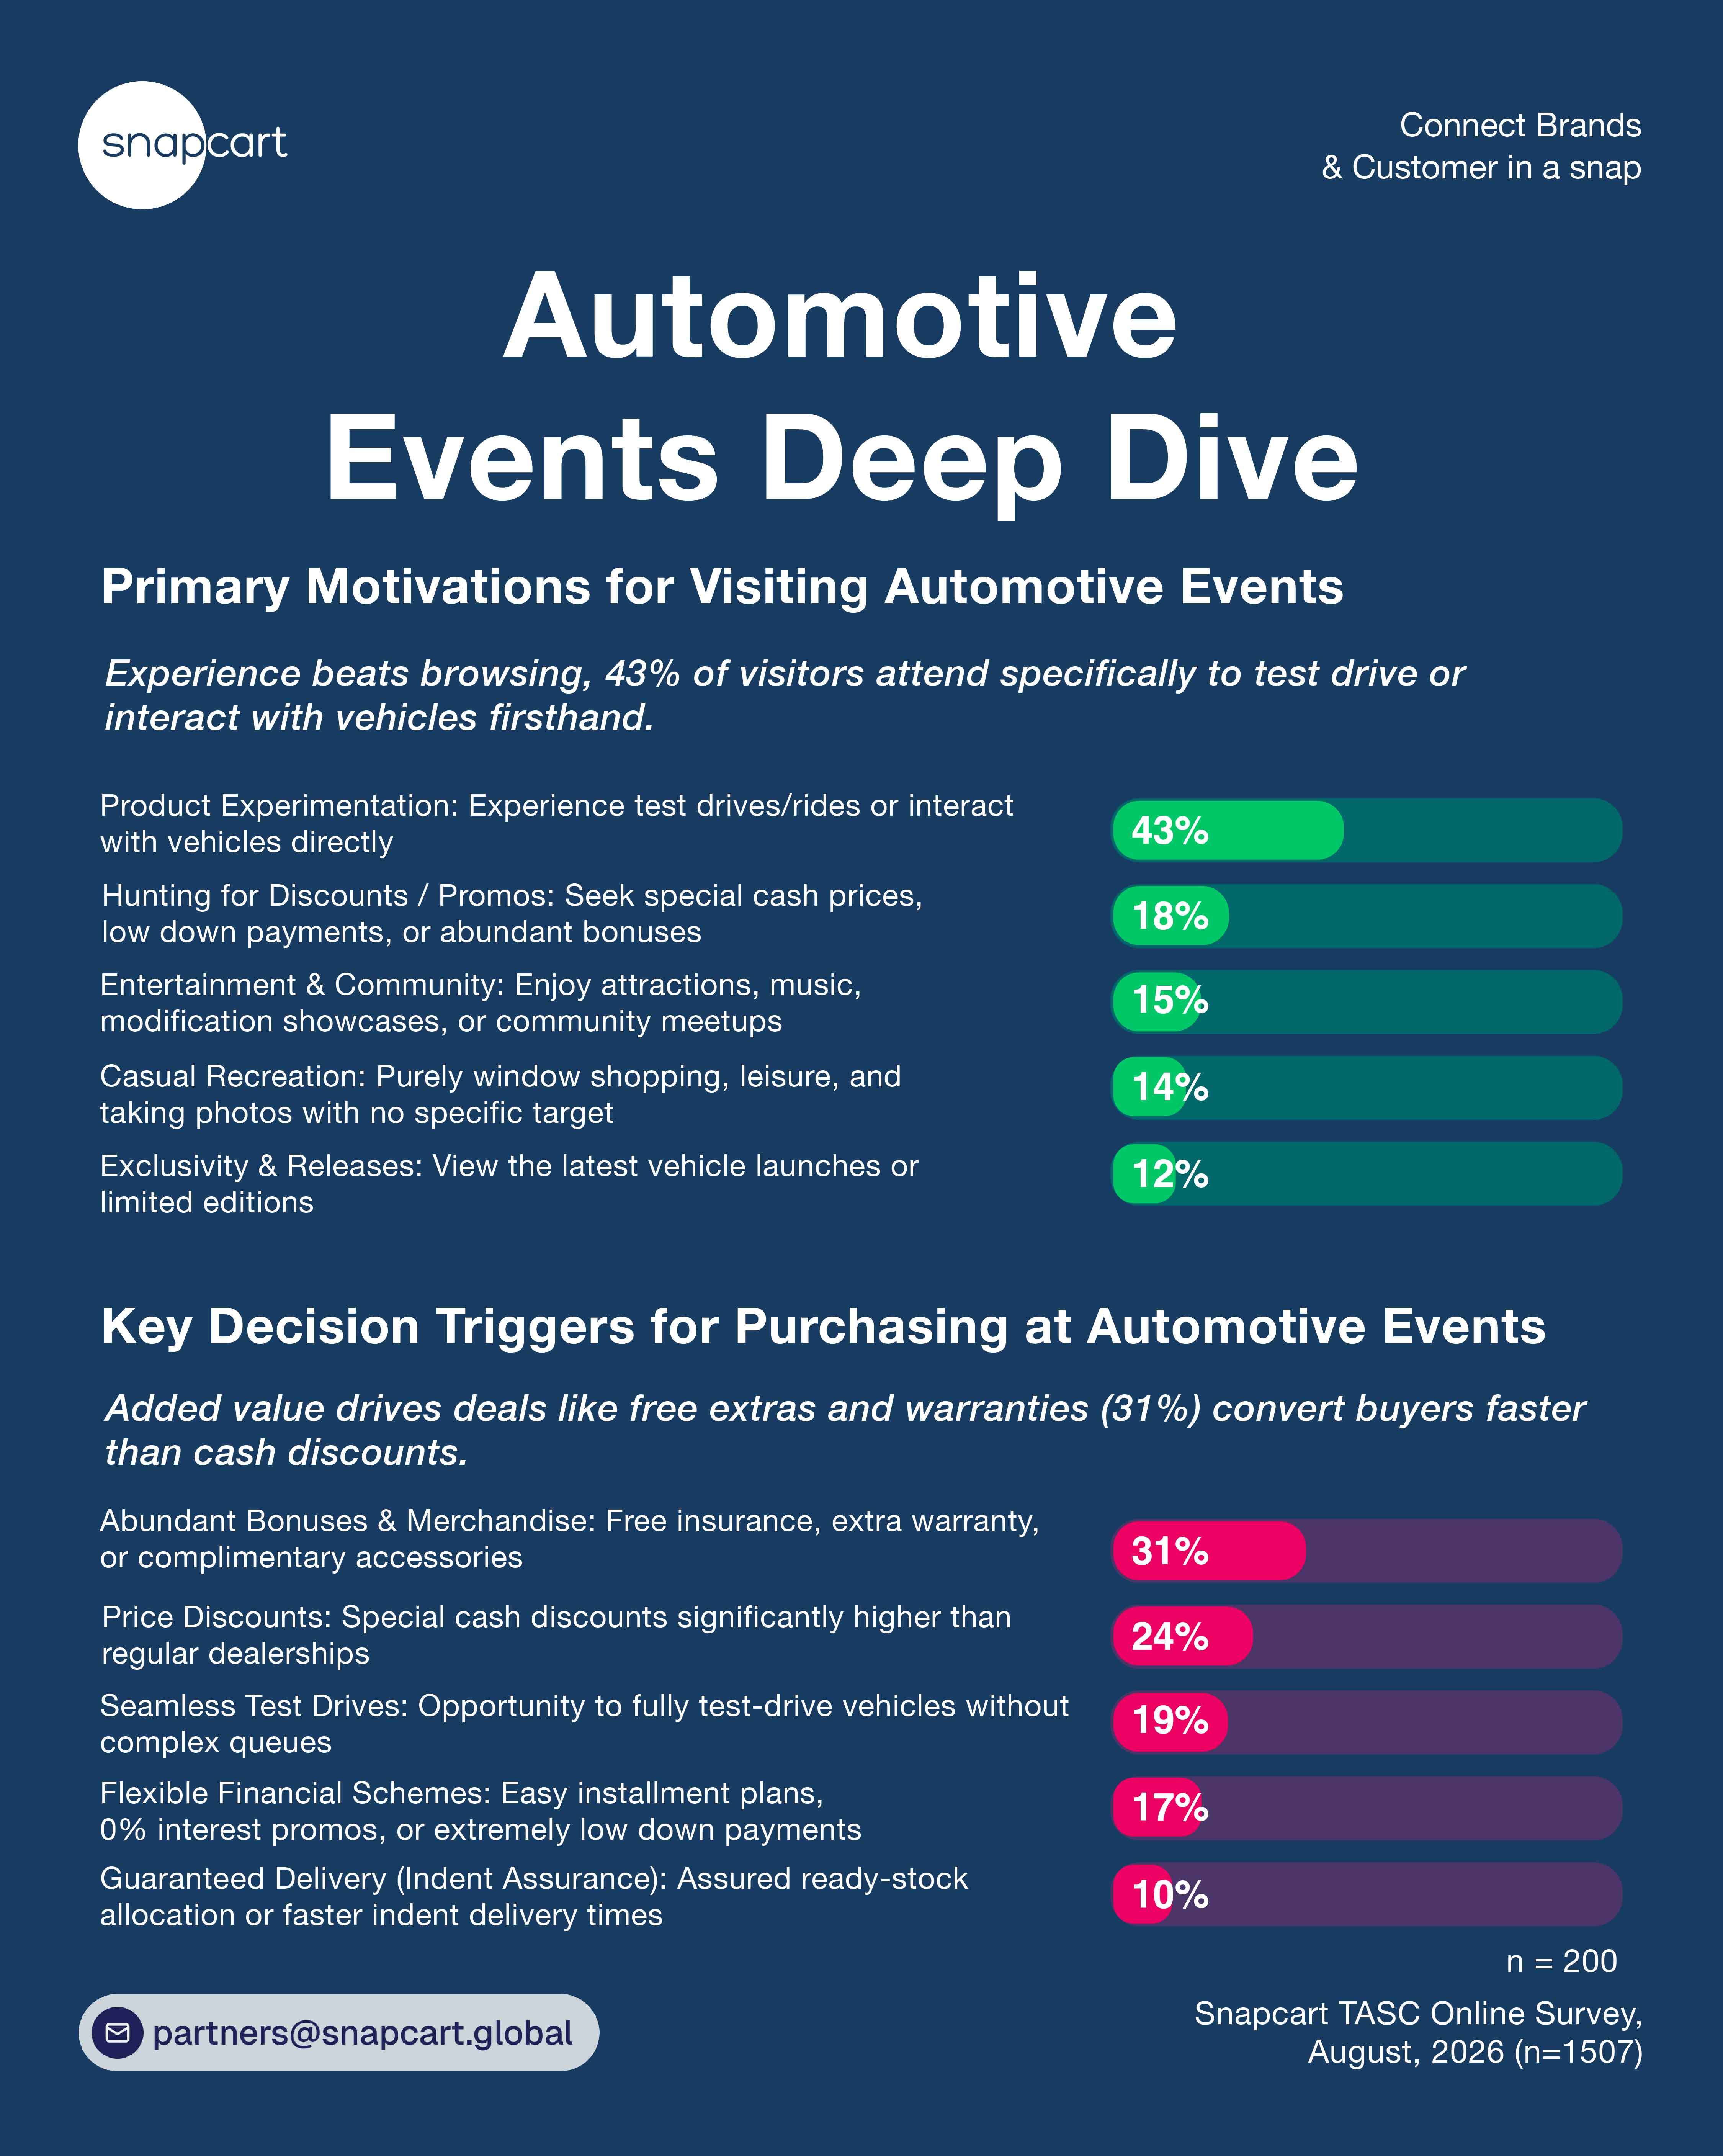
Physical product testing is the primary motivation for automotive visitors, with 43% attending specifically to test drive/test ride or interact with vehicles, outranking hunting for discounts/promos (18%), entertainment and community exhibitions (15%), casual recreation (14%), and viewing new vehicle launches (12%). On-site transactions are triggered primarily by abundant bonuses like free insurance and extra warranties (31%), special discounts than regular dealerships (24%), seamless test drive access (19%), light financing/0% interest promos (17%), and guaranteed ready-stock/faster indent times (10%). This demonstrates that within high-involvement automotive purchases, physical product interaction creates initial engagement, whereas financial add-ons and risk-mitigating incentives ultimately close high-value floor transactions
Moms, Baby & Kids Events
Examples: IMBEX, Mommy n Me, Baby Market Festival, etc.
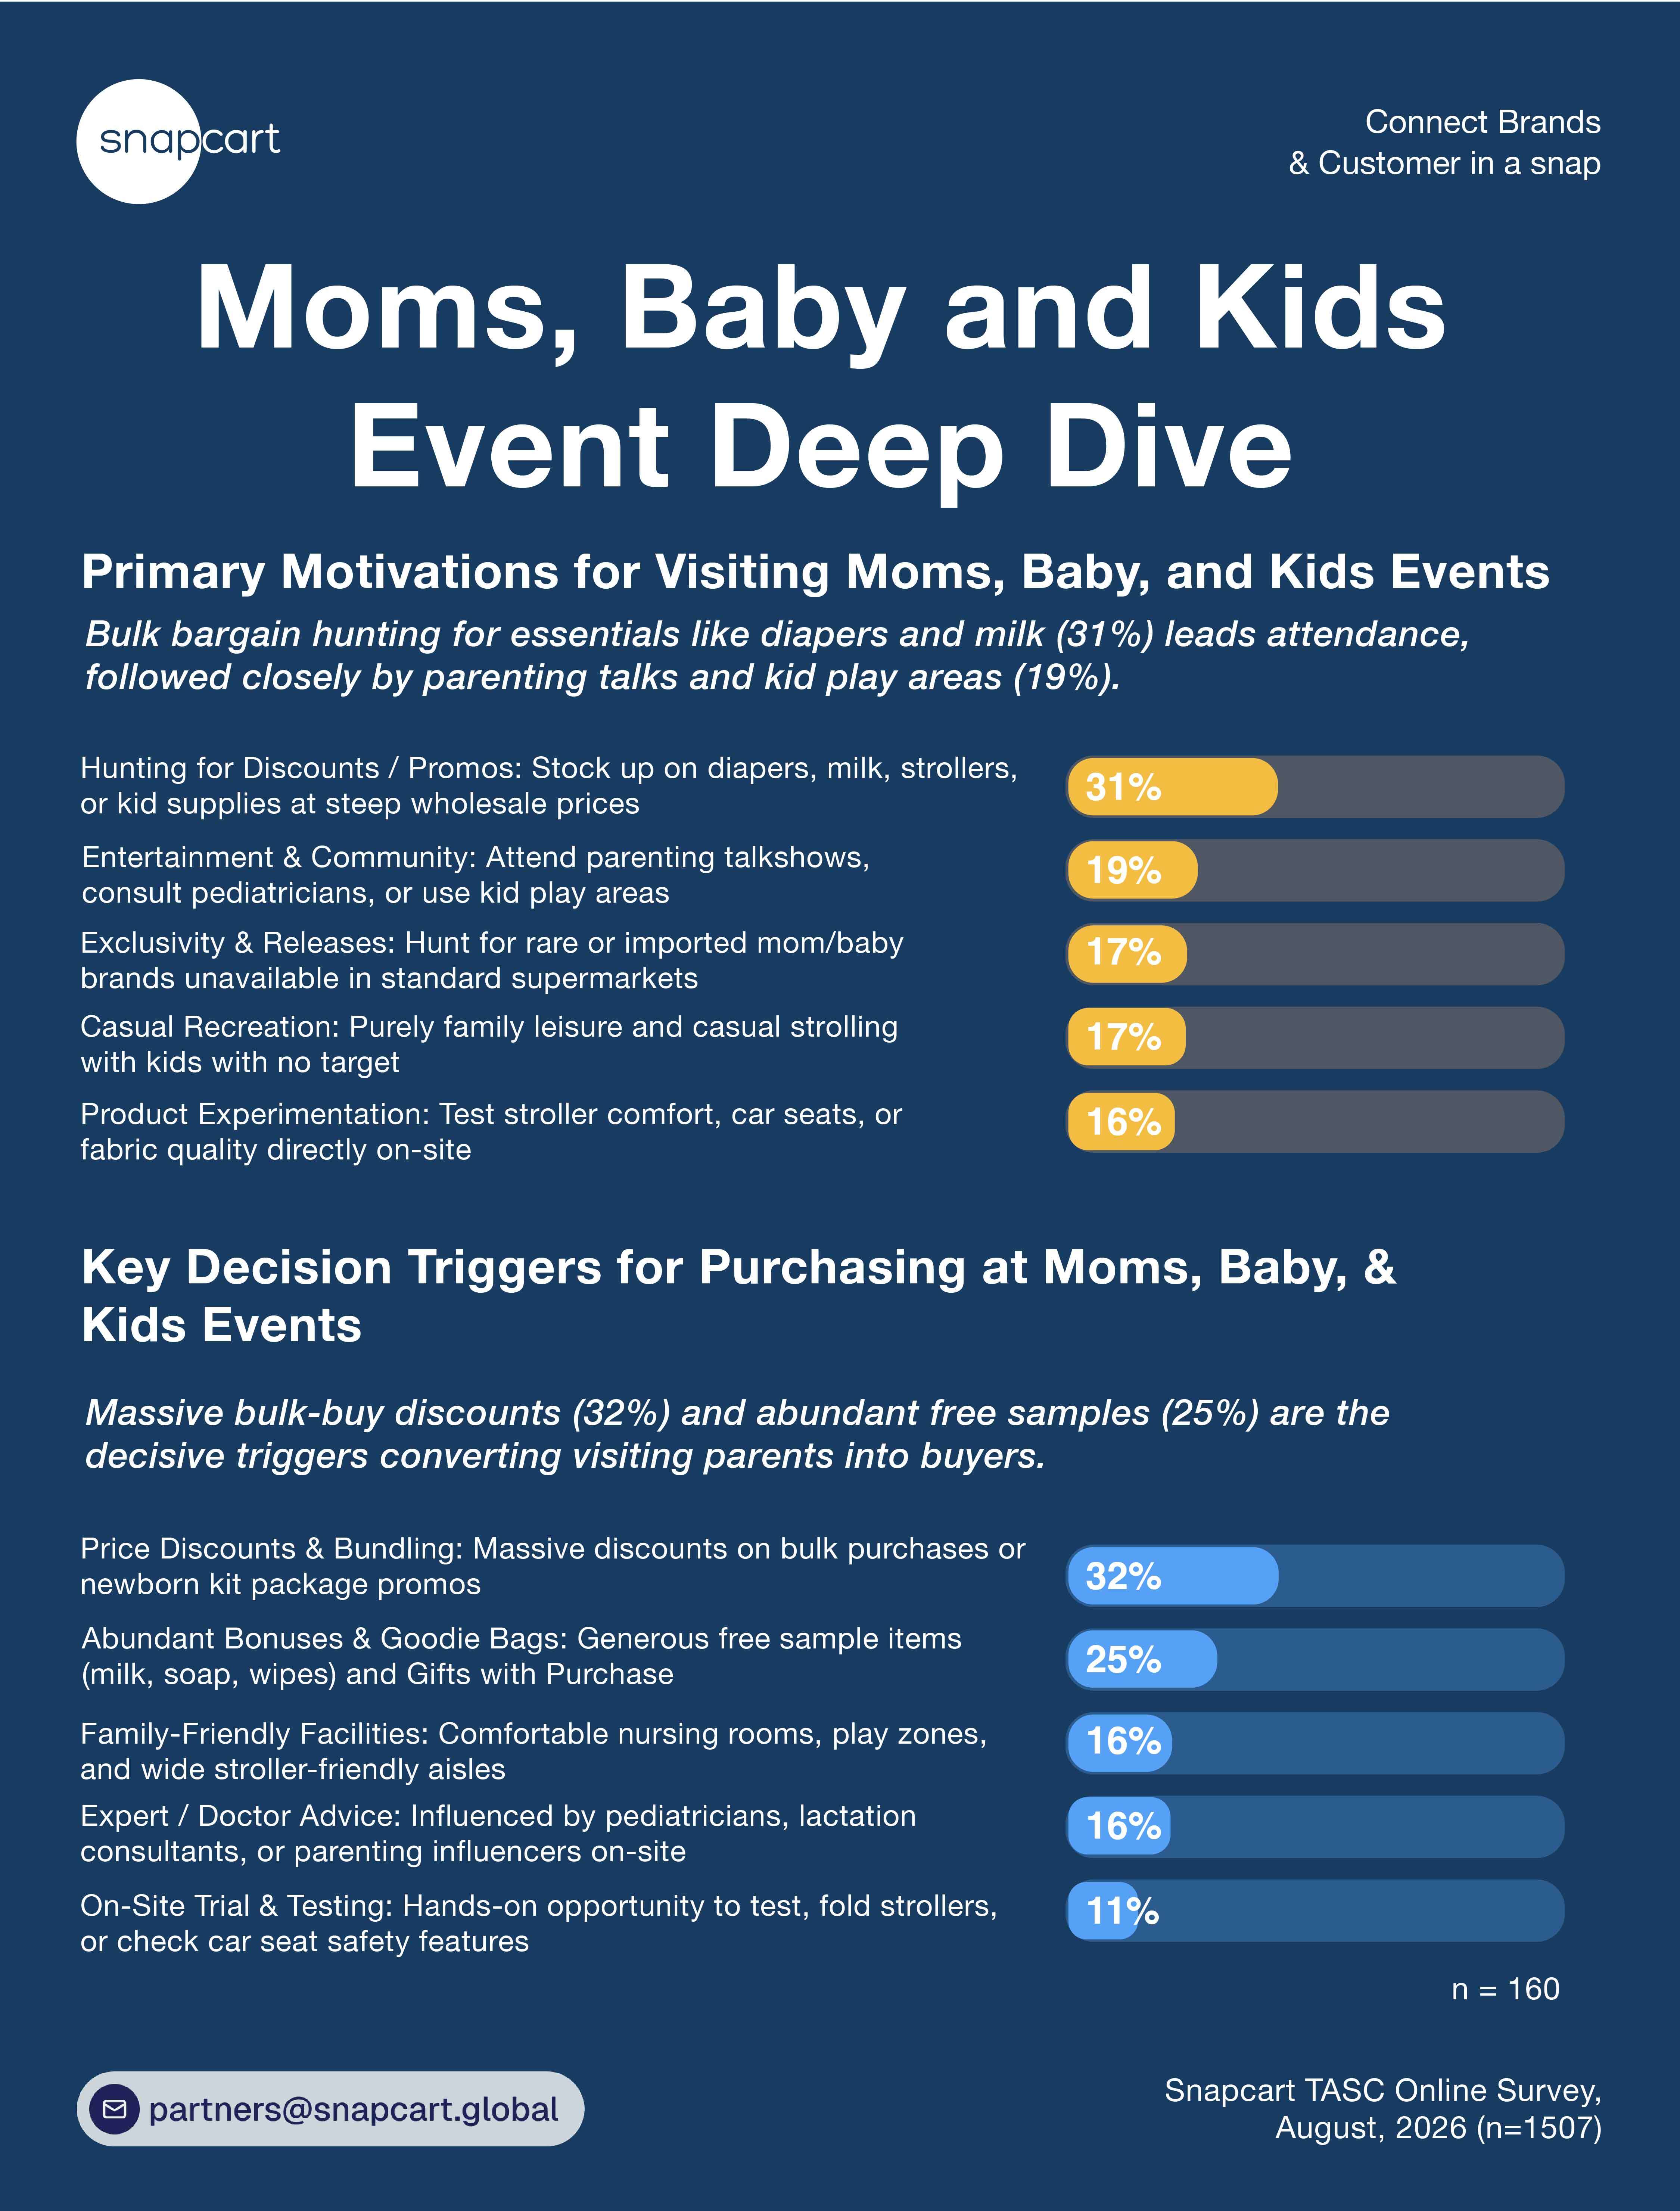
Wholesale bargain hunting for essentials like diapers and formula leads motivation for 31% of parenting expo visitors, followed by parenting talkshows/kids playgrounds (19%), imported brand hunting (17%), casual family recreation (17%), and stroller/car seat testing (16%). Purchases are triggered directly by bulk discounts (32%) and abundant free samples/GWP (25%), supported by family-friendly facilities (16%), expert/doctor advice (16%), and stroller trials (11%). This confirms that parenting expos function as high-utility restocking centers where immediate savings on household consumables directly drive bulk transaction volume.
Key Takeaways for Brands and Event Organizers
1. Optimizing for Omnichannel Showroom
With 48% of survey respondents trying products at events but completing their purchases later on e-commerce platforms, brands must recognize offline expos as crucial showroom / display touchpoints. Integrating trackable QR codes, digital vouchers, and online checkout options directly within booth displays enables brands to capture delayed online conversions post-event.
2. Aligning Category Activations with Verified Sector Triggers
Conversion triggers vary sharply across industries: sports buyers rely on physical trial/health-check facilities (71%), book buyers depend on organized genre layouts (58%), tech consumers demand warranty guarantees (59%), and fashion shoppers respond to KOL styling cues (35%). Booth activations should be built around these specific category mechanics rather than generic sales setups.
3. Leveraging Experiential Magnets for Foot Traffic
Major verticals show dominant non-commercial attendance drivers, such as Tech (54% e-sports/seminars), Sports (60% group workouts), Books (48% author sessions), and Fashion (45% social vibe). Incorporating live programming and community spaces provides the necessary foot traffic foundation to feed surrounding commercial zones.
4. Resolving Logistical Friction to Protect Visitor Spending
While 82% of attendees enter with an allocated shopping budget, pain points like high food/item pricing (31%), limited parking spots (26%), and crowd congestion (25%) impact overall visitor satisfaction. Organizers can encourage visit time and spending by prioritizing crowd control (37%), parking access (34%), toilet facilities (29%), and reliable cashless payment infrastructure (17%).
5. Capturing Spontaneous Attendance Through Real-Time Social Proof
With 38% of visitors attending events on impulse right after seeing viral content online and 31% driven by influencer reviews, event marketing cannot stop once doors open. Brands and organizers must deploy real-time, on-site content creators (IG/TikTok live coverage, visual photobooths, and instant UGC incentives) during event days to trigger FOMO (Fear of Missing Out) wave and pull spontaneous weekend foot traffic.
Need to learn more about consumer habits and behavior? Contact us at partners@snapcart.global.